
You can post every day, rack up impressions, and still feel like nothing is moving. The comments are thin, saves are unpredictable, and the “likes” you do get don’t seem to translate into clicks, leads, or sales.
That’s usually not a content problem. It’s a measurement problem. Once you measure social media engagement in a consistent way—across platforms, formats, and campaigns—you stop guessing and start making decisions you can defend in a meeting (and repeat next month).
Article Outline
- What It Means to Measure Social Media Engagement
- Why Measuring Social Media Engagement Matters
- Framework Overview
- Core Components
- Professional Implementation
What It Means to Measure Social Media Engagement

To measure social media engagement is to quantify how people actually interact with what you publish—then interpret those interactions in context. Not just “how many saw it,” but what they did next: reacted, commented, shared, saved, clicked, replied, watched, or took an action that signals real intent.
Most platforms define engagement as a bundle of actions, but the bundle isn’t identical everywhere. Meta’s own help docs, for example, group engagement around actions like reactions, comments, shares, and clicks. Meta’s Page Insights definitions and Meta’s breakdown of post engagement show how those interactions are counted and reported. On YouTube, engagement metrics sit alongside retention and watch behavior, because a “like” means less if viewers abandon the video after a few seconds. YouTube Analytics metrics documentation
So the goal isn’t to chase a single universal number. The goal is to build a measurement approach that stays consistent for your team, maps to the actions your audience can take on each platform, and connects engagement to outcomes you care about.
One more nuance that changes everything: the denominator you choose can completely flip the story. Engagement “by followers” answers “how active is our community?” Engagement “by reach” answers “how compelling is this for the people who actually saw it?” Engagement “by impressions” is often the cleanest way to compare paid campaigns, because impressions align with buying models like CPM. Hootsuite’s engagement rate calculation guide
Why Measuring Social Media Engagement Matters
Engagement is the earliest reliable signal that your creative is doing its job. Reach can be inflated by distribution. Views can be misleading (especially on short-form video). Engagement, when measured properly, tells you whether people found the content valuable enough to spend effort—time, attention, or social capital.
It also tells you where you’re earning trust versus where you’re simply being tolerated. That matters because social has become a primary touchpoint for how people evaluate brands and decide whether to keep giving you chances. In Emplifi’s consumer-brand survey, one bad experience drives away roughly a quarter of consumers—so the quality of interactions you create (and how you respond) can directly shape loyalty. Emplifi “Social Pulse” consumer-brand survey (2025)
Measuring engagement also prevents a common trap: over-optimizing for the easiest interaction. Likes are easy. Comments are harder. Saves and shares are even harder, because they signal personal utility (“I want this later”) or social endorsement (“someone else should see this”). If you only track the easiest signal, you’ll accidentally train your content strategy to become forgettable.
Finally, engagement measurement is how you benchmark without spiraling. Benchmarks can provide sanity checks, but they’re only useful if you compare apples to apples—same platform, same format, and the same formula. If you want a recent reality check across major networks, Hootsuite publishes industry engagement rate averages using a consistent approach across platforms. Hootsuite average engagement rates (Jan 2025)
Framework Overview
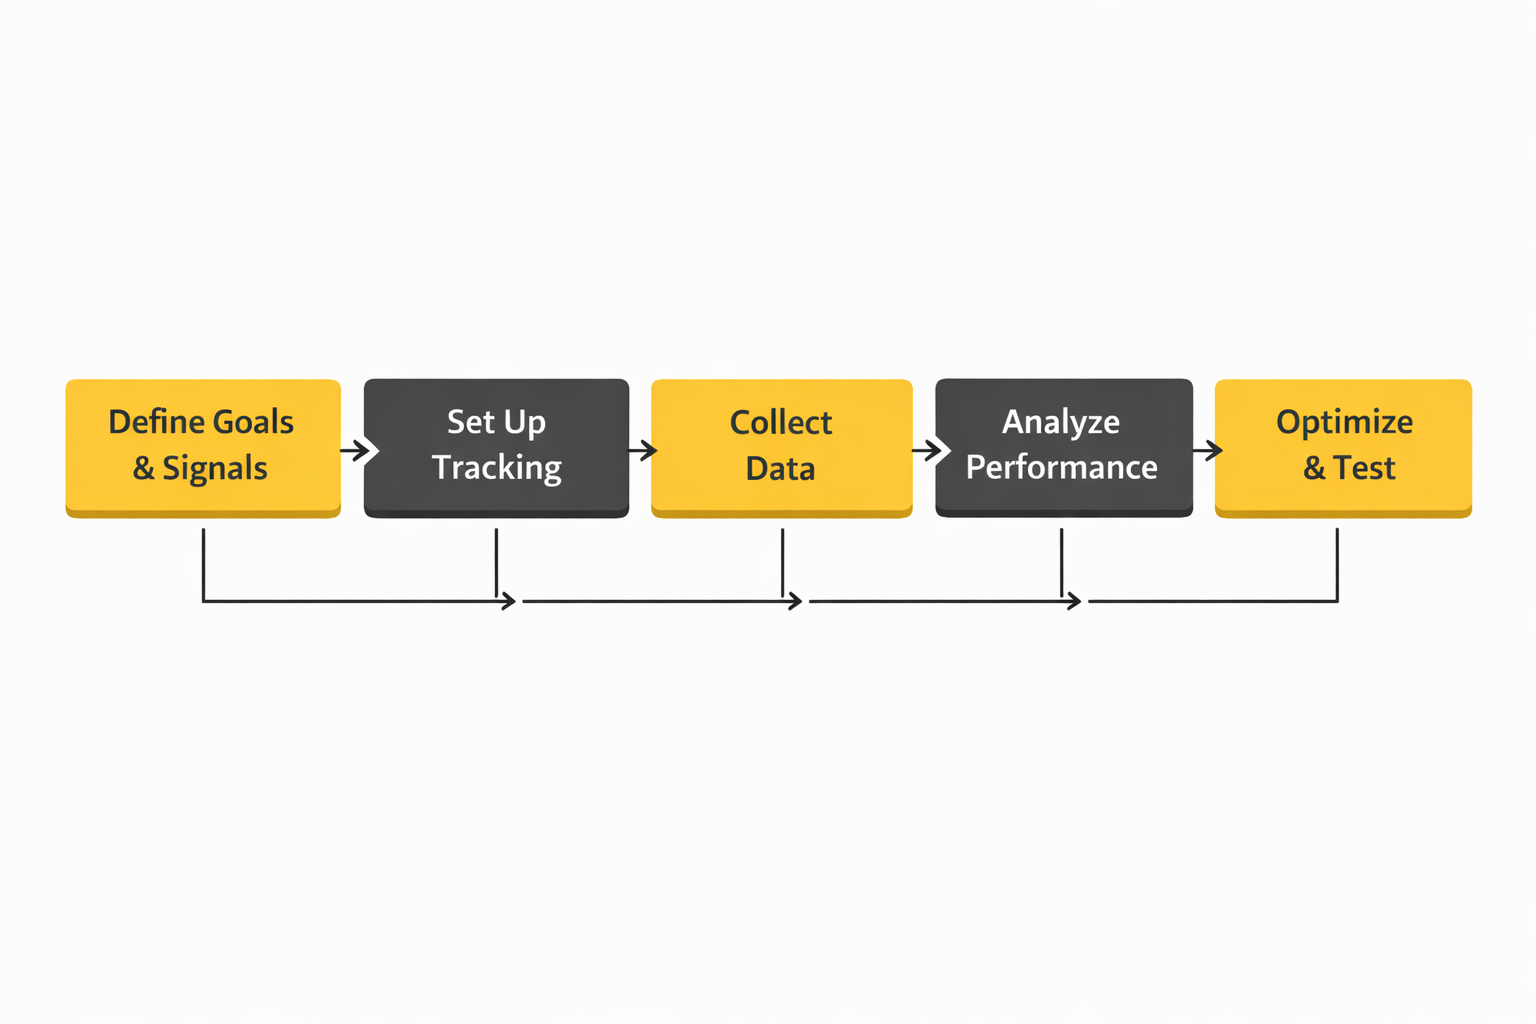
This framework is designed to help you measure social media engagement in a way that holds up across channels, reporting cycles, and stakeholder expectations:
- Define engagement for your business (what actions matter, and why).
- Standardize formulas (choose denominators intentionally and keep them stable).
- Separate signals by depth (light, medium, deep engagement).
- Map engagement to intent (what engagement predicts a click, a lead, a sale, or retention).
- Operationalize measurement (tracking, tagging, QA, dashboards, and review cadence).
It’s a practical hybrid of platform-defined metrics (so you’re not fighting the data) and decision-grade reporting (so leadership can act on it). That’s important because even “engagement” is evolving: industry measurement bodies are increasingly pushing beyond exposure into higher-quality signals like attention and outcomes, which affects how teams justify performance. IAB/MRC Attention Measurement Guidelines (Nov 2025)
Core Components
When teams measure social media engagement well, they usually break it into a few core components instead of forcing one number to do everything.
1) Engagement Actions
Start with the raw actions your audience can take. The key is to track them consistently and resist “metric drift” when platforms rename or restructure reporting.
- Approval signals: reactions/likes (fast sentiment checks).
- Conversation signals: comments/replies (effort + context).
- Amplification signals: shares/reposts (social distribution).
- Utility signals: saves/bookmarks (future intent).
- Action signals: link clicks, profile visits, DMs, follow actions (movement toward outcomes).
Use platform documentation to stay aligned with how actions are counted. On Meta, engagement reporting commonly centers on reactions, comments, shares, and clicks. Meta Page Insights engagement definitions TikTok’s ad platform also publishes metric definitions and reporting basics, which helps keep paid measurement grounded in the same language your media buyer sees. TikTok Ads Manager basic metrics and definitions (updated Oct 2025)
2) Engagement Rate Formula
Choose one primary engagement rate and stick to it for trend reporting. Most teams choose engagement rate by impressions for cross-campaign comparisons, and engagement rate by reach for organic content evaluation. The important part is not which you pick—it’s that your team uses the same one every month. Engagement rate formulas and examples
3) Context Metrics That Explain Engagement
Engagement doesn’t exist in a vacuum. If engagement changes, you need a short list of supporting metrics that explain “why,” without turning reports into spreadsheets nobody reads.
- Distribution context: reach, impressions, frequency.
- Consumption context: watch time, retention, completion (especially for video). YouTube engagement and retention metrics
- Audience context: follower growth, returning viewers, community composition shifts.
4) Benchmarks and Expectations
Benchmarks should be used as guardrails, not goals. A useful benchmark is recent, transparent about methodology, and broken down by platform and industry. If you need current platform-level baselines to sanity-check performance, Hootsuite’s 2025 benchmark snapshots offer a practical starting point for many industries. Hootsuite average engagement rates (Jan 2025)
Also remember that “good engagement” depends on where your audience actually is. Pew’s 2025 research is a helpful reminder that platform reach varies widely—YouTube and Facebook still reach large shares of adults, while TikTok, WhatsApp, Reddit, and Instagram continue shifting by age and demographic group. Pew Research Center: Americans’ Social Media Use 2025
Professional Implementation
The difference between casual reporting and professional measurement is operational discipline. Pros make it hard to “accidentally” change definitions, and easy to explain performance without hand-waving.
Build a Measurement Dictionary
Create a single source of truth that defines each engagement metric your team reports, the formula you use, the denominator you chose, and where the data comes from (native platform, API, or third-party). This prevents the classic problem where one person reports “engagement” as likes + comments, while another includes shares, saves, and clicks.
Separate Organic vs. Paid from Day One
Engagement behaves differently in paid distribution, and the denominator choice matters more. For paid, impressions-based engagement rate often maps cleanly to media buying logic and makes cross-campaign comparisons less messy. Engagement rate by impressions formula
Instrument Campaigns with Naming, Tagging, and UTM Rules
If engagement is supposed to predict outcomes, you need reliable attribution paths. Use consistent naming conventions for campaigns and creatives, and standardize UTM parameters for link-based posts so your analytics stack can tie “what people did on social” to “what happened next” on-site.
Use Platform APIs When You Need Consistency at Scale
Native dashboards are fine until you need repeatable reporting across brands, regions, or clients. APIs help you pull the same fields on the same cadence. X, for example, provides post analytics endpoints for retrieving engagement-related data within defined windows, which can support standardized reporting workflows. X API: Get post analytics
Adopt a Review Cadence That Forces Decisions
A professional engagement report isn’t a recap—it’s a decision memo in disguise. A simple rhythm works:
- Weekly: creative diagnostics (what’s spiking, what’s dropping, what changed).
- Monthly: trend reporting against your chosen engagement rate formula, plus 3–5 insights tied to actions.
- Quarterly: benchmark refresh, measurement QA, and metric definitions review (especially after platform reporting changes).
In the next sections, the framework gets more concrete: what to measure at each “depth” of engagement, how to interpret those signals by content type, and how to turn engagement data into repeatable creative and distribution decisions.
Step By Step Implementation
The fastest way to make engagement reporting feel “real” is to implement it like an operating system, not like a one-off report. When you measure social media engagement step by step, you’re building a loop that turns posts into signals, signals into decisions, and decisions into better posts.
Step 1: Define Which Engagement Actions Count
Start by writing down the actions that matter for your brand and why they matter. A “like” might be enough for quick sentiment checks, but saves, shares, replies, and link clicks usually carry more intent, because they require more effort (or indicate future behavior). If you have video-heavy channels, treat watch behavior as part of engagement because retention is often the most honest signal of real interest. YouTube Analytics metrics definitions
Step 2: Pick One Primary Engagement Rate
Choose one engagement rate formula for trend reporting and keep it stable. Most teams either normalize by reach (organic content) or by impressions (paid comparisons), but the key is consistency so month-to-month trends don’t get distorted by a denominator change. If your stakeholders regularly compare performance across channels, a consistent formula is what prevents “this platform is better” arguments that are really just math arguments.
Step 3: Create A Simple Measurement Dictionary
This is the document that keeps your reporting from drifting. Define what each metric means, where it comes from (native dashboard, API, social suite), and how you calculate your headline KPIs. Platform changes are not hypothetical; they regularly affect reporting workflows, so your dictionary is how you keep continuity when the ground shifts. An example of metric changes affecting reporting
Step 4: Standardize Link Tracking For Anything That Leaves The Platform
If engagement is supposed to lead to outcomes, you need clean tracking inputs. Use UTMs for every link-based post, and document naming rules so “campaign” means the same thing across the team. It’s not glamorous, but it’s what makes your social engagement report connect to on-site behavior without guesswork. UTM parameters and campaign tracking in Google Analytics
Step 5: Instrument Conversions For Paid Social
For paid campaigns, engagement is valuable, but it’s usually not the final score. Implement conversion tracking properly so you can connect engagement to signups, leads, and purchases in a way that remains resilient as browser tracking gets noisier. Server-side options and best-practice implementation guidance are worth reviewing early, not after reporting breaks. Meta Conversions API best practices
Step 6: Build A Weekly And Monthly Review Loop
Weekly review is for creative diagnostics: what spiked, what dropped, what changed. Monthly review is for trend clarity: what’s improving over time, what’s plateauing, and what you’ll change next month based on evidence. If your process doesn’t produce decisions, it’s not a measurement system yet.
Execution Layers
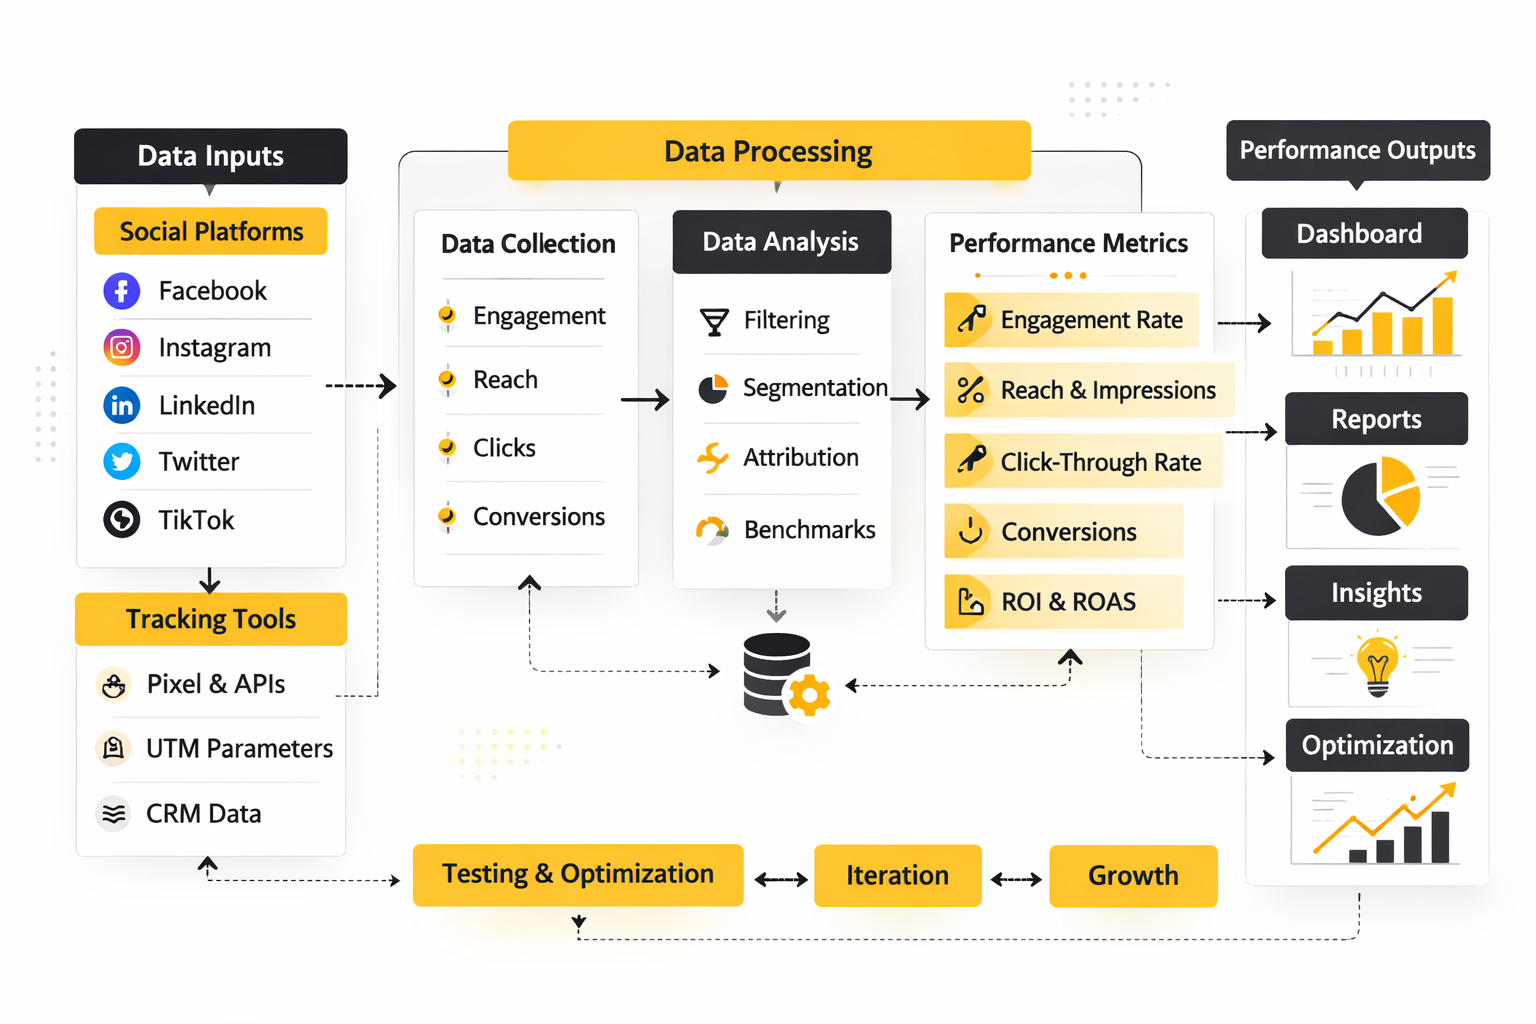
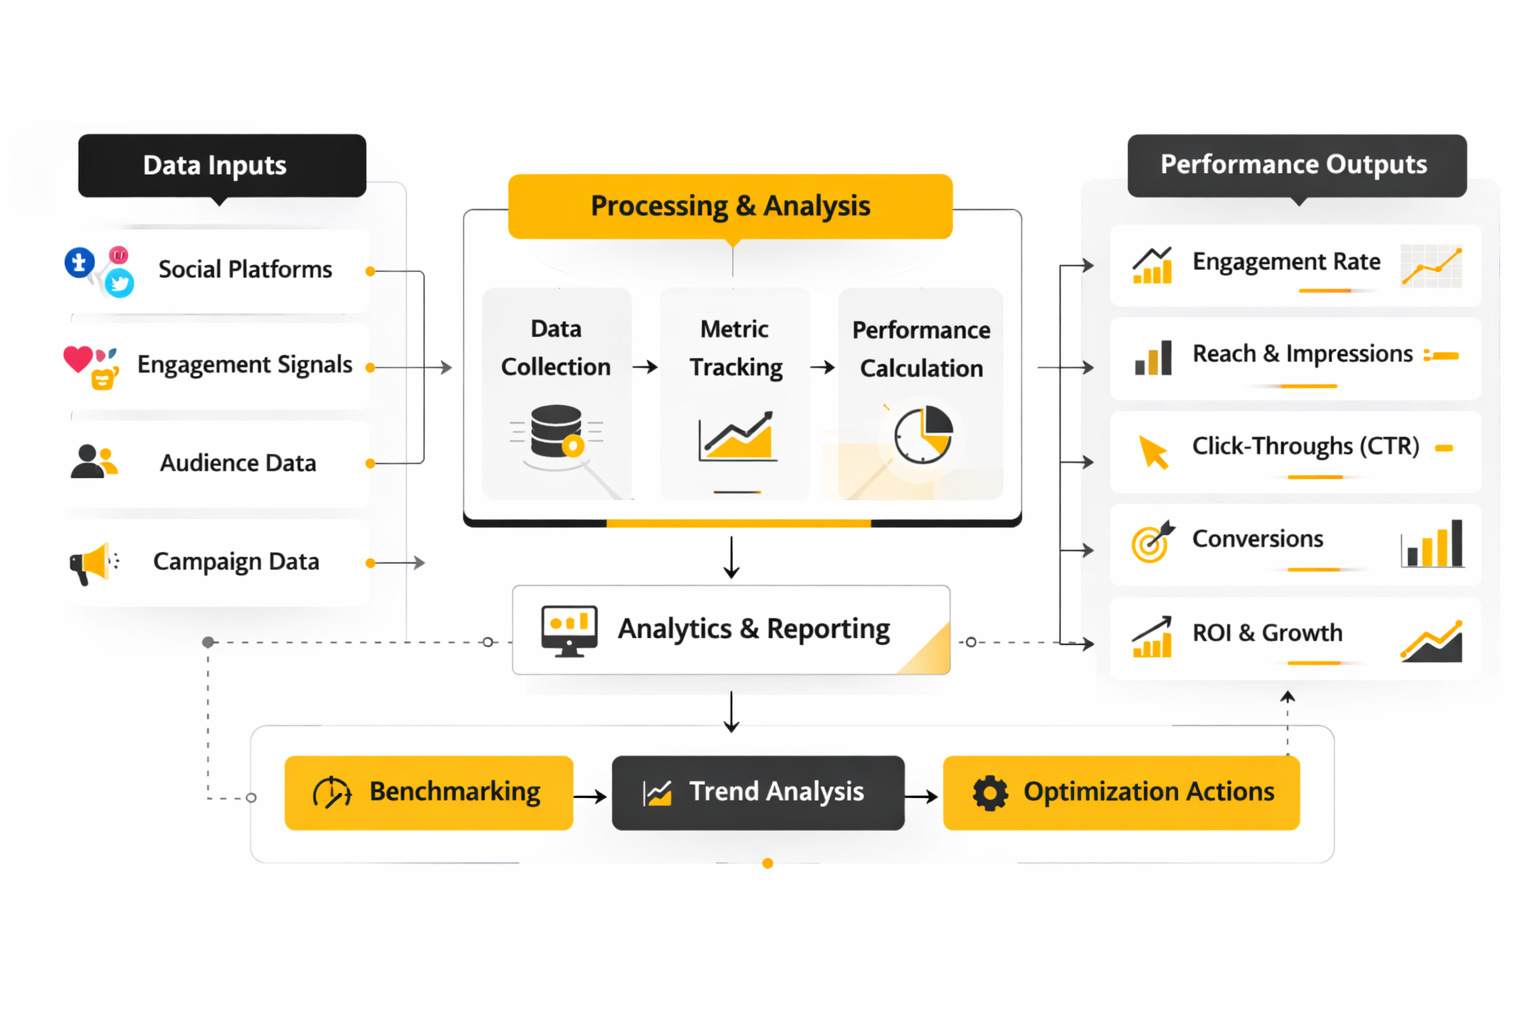
When teams say they “measure engagement,” they often mean they look at a dashboard. In practice, measuring social engagement well has layers, and each layer answers a different question.
Layer 1: Tracking Foundation
This is your data plumbing: consistent metric definitions, stable formulas, and clean tracking for clicks and conversions. It’s also where you decide which sources are authoritative for each platform and how you’ll handle inconsistencies across tools. If you skip this layer, your reports will look polished but won’t be trustworthy.
Layer 2: Operational Workflow
This is where measurement becomes repeatable. You implement publishing approvals, tags/labels, and a consistent naming convention so you can compare content types without manual cleanup. If you work across many accounts or locations, centralization becomes less about control and more about visibility and fairness in reporting.
Layer 3: Insight And Context
Engagement spikes rarely happen in a vacuum. This layer adds context through listening, trend monitoring, and audience signals so you can explain “why” engagement moved instead of just reporting that it moved. If you’re using attention measurement concepts, treat them as complementary signals that help you interpret engagement beyond delivery metrics. IAB/MRC Attention Measurement Guidelines (Nov 2025)
Layer 4: Decision And Action
This is the final layer most teams forget to formalize. You translate engagement patterns into a clear set of actions: what to replicate, what to stop, what to test next, and what to change in distribution. Without this layer, engagement measurement becomes entertainment rather than strategy.
Optimization Process
A good optimization process makes your numbers easier to interpret over time. It protects you from reacting emotionally to one post and instead helps you build a portfolio of repeatable wins.
1) QA Your Inputs Before You Interpret Outputs
If a chart looks weird, assume the tracking might be wrong before assuming the audience changed overnight. Check that UTMs are formatted correctly, that posts were labeled consistently, and that your reporting tool didn’t silently change a metric definition. When platforms deprecate or modify metrics, your reporting can drift without anyone noticing unless you build a habit of lightweight reconciliation checks. Example of reporting impact from metric changes
2) Segment By Format And Intent
Compare like with like: short-form video against short-form video, carousels against carousels, link posts against link posts. Then interpret engagement with intent in mind. A save-heavy post usually behaves differently from a comment-heavy post, and the “best” post depends on what your campaign needs next.
3) Run Small Tests, Not Big Rebrands
Optimization works best when you test one variable at a time: hook, thumbnail, caption structure, CTA placement, posting time window, or creative angle. Keep test windows short, define what “better” means before you publish, and use the same engagement rate formula so results are comparable. You’re not trying to win one week; you’re trying to build a playbook you can reuse.
4) Connect Engagement To What Happens Next
This is where measurement becomes persuasive. If a content series drives fewer likes but consistently drives more qualified clicks, that’s a strategic win you can defend. UTMs give you the bridge from “engaged on social” to “acted on-site,” which is why disciplined tagging is so valuable. How UTMs support acquisition reporting in GA
Implementation Stories
Real engagement measurement transformations usually start with pressure. A team is stretched thin, the brand is growing, and the old way of reporting doesn’t survive contact with scale.
Petstock: Measuring Engagement Across 90+ Channels Without Losing Quality
The moment the system broke was not subtle. Petstock’s social presence had expanded across an enormous number of channels, and the central team was tiny. Every day felt like a choice between keeping content consistent or keeping community management responsive, and both mattered. Petstock case study
The backstory was scale that arrived faster than process. Petstock operates across many locations and services, and a single central page simply couldn’t speak to every community in a way that felt local. The team needed a way to coordinate content and engagement without turning everything into generic corporate messaging. How Petstock described the challenge
The wall showed up as operational overload. Managing multiple social channels with a small team makes measurement feel impossible because there’s no time to label, compare, and learn; you’re always shipping. Even when content performed well, it was hard to prove what was working and hard to replicate success across locations. Petstock on managing multiple social channels
The epiphany was realizing that measurement had to be built into daily work, not added later. They leaned into a system where publishing, engagement management, and performance analysis lived together, so reporting didn’t require a separate “analytics day.” They also treated benchmarking and campaign analysis as a normal part of the workflow instead of a quarterly project. Petstock on using Measure and Benchmark tools
The journey was practical, not magical. They planned content weeks ahead to keep output consistent while still being able to pivot quickly when priorities changed. They also used performance insights to understand what worked inside campaigns and how their content stacked up against competitors, which made engagement measurement actionable rather than descriptive. Petstock on scheduling and post-campaign analysis
The final conflict was the messy reality of local relevance. What performs in one region doesn’t always land in another, especially when audiences differ between urban and rural communities. Without structure, that difference can look like “random engagement,” but with a system, it becomes a map that shows where localized content needs to diverge. Petstock on localized content for diverse audiences
The dream outcome was a calmer, smarter machine. Content activity became more streamlined, and measurement stopped being a stressful afterthought. The team could deliver more relevant content without sacrificing quality, because engagement insights were now part of how they worked, not just what they reported. Petstock outcomes summary
Professional Implementation Checklist
If you want to measure social media engagement in a way that survives handoffs, platform changes, and stakeholder scrutiny, treat implementation like a checklist you can audit.
Metrics And Definitions
- Document engagement actions: Define what counts as engagement per platform and keep the definition stable.
- Lock your engagement rate formula: Choose a denominator and use it consistently for trend reporting.
- Use official metric definitions for edge cases: Especially for video engagement and retention. YouTube metric definitions
Tracking And Attribution
- UTM naming rules: Standardize campaign/source/medium values so reporting stays clean. Google Analytics UTM guidance
- Paid conversion instrumentation: Implement durable measurement so you can connect engagement to outcomes with confidence. Meta Conversions API best practices
Reporting And Governance
- One reporting layer: Keep stakeholders out of screenshot-land by using a consistent dashboard/reporting environment.
- Monthly reconciliation: Spot-check a small sample of posts between native analytics and your reporting layer to catch connector drift early.
- Change monitoring: Track platform metric changes so your KPIs don’t shift silently. Example of platform change impact
Operations
- Taxonomy: Tags/labels for format, campaign, audience, and intent so you can compare performance without manual cleanup.
- Cadence: Weekly diagnostics, monthly trends, and quarterly definition audits.
- Decision outputs: Every reporting cycle ends with a short list of actions: replicate, stop, test, and refine.
Statistics And Data
When you measure social media engagement with real rigor, data stops being “nice to know” and becomes the thing that prevents expensive mistakes. The trick is knowing which numbers are stable enough to trust, which ones are useful only as directional signals, and which ones are so dependent on methodology that they should never be compared without context.
A useful starting point is separating engagement data into three buckets: content response (likes, comments, shares, saves), attention behavior (video watch, completion, repeat views), and downstream intent (clicks, profile visits, DMs, form starts, purchases). That separation is increasingly important as measurement standards keep shifting toward quality signals like attention, not just exposure. Attention measurement guidance from IAB and MRC
One category that keeps showing up as a true “engagement multiplier” is responsiveness. Social engagement isn’t only what people do to your content; it’s also what they do after you respond. Many consumers now expect near-immediate replies to DMs and tags, and that expectation is visible across multiple independent datasets: Emplifi’s consumer research highlights that roughly one-third expect a DM reply within an hour, with only a small minority willing to wait two days. Emplifi Social Pulse consumer-brand survey (2025) Emplifi press release summarizing the same expectation (Jan 2026) MarketingCharts write-up of the same one-hour expectation (May 2025)
That matters for measurement because it changes what “good engagement” looks like. A post with fewer public likes but more DMs might be doing more business work than a post with a big like count and no real conversations. If your dashboard can’t show that distinction, it’s not telling the truth about your performance.
Performance Benchmarks
Benchmarks are helpful when they keep you honest, and harmful when they tempt you into chasing somebody else’s goal. The safest way to use them is to pick one benchmark methodology and stick to it for a full quarter, then revisit.
Why Methodology Changes Everything
One report might calculate engagement per follower, another per reach, another per impressions, and some blend paid and organic. That’s why two credible benchmark sources can “disagree” while both are technically correct. Your job is to choose the formula you’ll use to measure social media engagement and then only compare against benchmarks that use a comparable denominator.
Recent Cross-Platform Baselines You Can Actually Use
If you want a practical, recent baseline that is transparent about how it calculates engagement, Hootsuite’s 2025 benchmarks include platform-wide engagement-rate snapshots and also relate engagement to posting frequency patterns. Hootsuite social media benchmarks (Apr 2025)
For a second independent view, Emplifi’s 2025 benchmark report provides reach-based engagement comparisons across formats and platforms, including a useful comparison where Reels reach engagement outpaces TikTok’s average reach engagement rate around the 1.7% range. Emplifi Social Media Benchmarks Report (2025)
And if you want a third lens that can help validate directional expectations, Hootsuite’s overall TikTok engagement rate peak around 1.71% shows up in its 2025 benchmark analysis as well. Hootsuite TikTok engagement benchmark context Emplifi’s comparable TikTok baseline Emplifi blog summary referencing the same TikTok baseline
LinkedIn’s Video Moment And Why It Warps Benchmarks
Benchmarks become especially fragile during major format shifts. LinkedIn is a good example: the platform has been investing heavily in video, and it has publicly shared that video watch is up 36% year over year while video creation is growing much faster than other original formats. LinkedIn’s statement on video growth (Feb 2025) Reuters reporting on LinkedIn video growth and uploads (Aug 2025) TechCrunch coverage of LinkedIn’s video upload jump (Feb 2025)
That’s the kind of ecosystem shift that can make your engagement “benchmark” move even if your content quality stays the same. When a platform changes what it pushes, your measurement system needs to separate “we improved” from “the feed changed.”
Analytics Interpretation
Numbers don’t interpret themselves. To measure social media engagement professionally, you need a simple interpretation model that prevents overreacting to spikes and helps you turn performance into decisions.
Start With The Question You’re Trying To Answer
- Creative quality: Did people respond more deeply than usual (comments, saves, shares, DMs), or was it mostly lightweight approval?
- Distribution change: Did reach, impressions, or frequency shift because the platform pushed the post more (or less)?
- Intent: Did engagement correlate with clicks, profile visits, and downstream actions you actually care about?
Interpret By Engagement Depth, Not Just Volume
One of the simplest ways to make engagement data useful is to rank interactions by effort and intent. Likes are fast signals; comments and replies add context; shares and saves are stronger endorsements; DMs and clicks are closer to action. If you treat all interactions as equal, you’ll reward content that gets easy reactions instead of content that moves people.
Why Response Time Belongs In Your Engagement Dashboard
Many teams track engagement but ignore response time, even though responsiveness is often what turns engagement into loyalty and conversion. Sprout’s 2025 Index framing is blunt: most consumers expect a response within 24 hours or sooner, and that expectation stays consistent across recent Index cycles. Sprout Social customer service overview referencing the 2025 Index Sprout Social customer service statistics page Sprout Social Index 2025 overview
When you combine that with Emplifi’s one-hour expectation for a meaningful share of consumers, it becomes clear why response time isn’t just “community management.” It’s a measurable engagement lever that can change how your audience behaves over time. Emplifi Social Pulse survey on one-hour DM expectations Emplifi press summary (Jan 2026) MarketingCharts breakdown of response-time expectations (May 2025)
What To Do When Metrics Conflict
You’ll see contradictions like “video views are up” while “video reach is down,” and both can be true depending on measurement window, content mix, and distribution. When that happens, trust sequence logic over single metrics: first validate distribution (reach/impressions), then validate attention (watch/retention), then validate intent (clicks/DMs). This sequence keeps you from “fixing” the wrong problem.
Case Stories
Case stories are where engagement measurement gets real, because they show what happens when a brand’s identity collides with the feed, the audience, and the business.
Duolingo: When A Single Moment Forces You To Measure What Matters
It hit like a sudden silence after a joke that didn’t land. One day the brand’s voice was everywhere, stitched into trends and conversations. Then the tone shifted, the feed felt quieter, and the team had to confront a scary question: was the “unhinged owl” actually doing business work, or was it just entertainment? Financial Times interview on Duolingo’s AI-first backlash and lessons
The backstory is that Duolingo didn’t stumble into engagement by accident. Its social team built a fast, creator-style workflow where they could move from idea to content in days, not weeks, and that speed helped them keep up with TikTok’s cultural cadence. Their process looked less like a corporate approval chain and more like a tight creative room with rapid iteration. Technical.ly profile on Duolingo’s viral workflow Wall Street Journal interview with Duolingo’s departing social media manager
The wall arrived when public reaction changed the rules. Leadership learned that a single controversial moment can flip the emotional temperature of a brand’s audience, and the “safe” response is often to pull back. But pulling back creates its own risk: if your growth and product engagement were being amplified by social momentum, silence can become a measurable drag. Business Insider on Duolingo’s lesson about edgy posts and engagement impact
The epiphany was that engagement needed to be measured as a system, not as a vibe. It wasn’t enough to look at likes; they had to watch what happened to usage and engagement signals when the content strategy shifted. When a CEO is willing to publicly say the tone change affected engagement, it’s a sign the internal measurement lens widened beyond vanity metrics. Business Insider on the engagement slowdown after tone changes Reuters on Duolingo’s engagement focus inside its 2026 strategy shift
The journey wasn’t about becoming “edgy again” for its own sake. It was about rebuilding a measurement loop that could separate brand voice from brand risk: what content fuels meaningful engagement, what triggers negative sentiment, and what changes downstream behavior in the product. Interviews with Duolingo leaders point to experimentation—testing how far they can go while staying aligned with trust and audience expectations. MediaCat interview on experimenting with less unhinged content Financial Times interview for broader context on messaging and perception
The final conflict is the part nobody likes to admit: measurement can punish you for being cautious. If a safer content strategy reduces the volume of backlash but also reduces the volume of attention, the dashboard won’t “reward” your restraint. That’s where mature measurement matters, because you need to track not just engagement volume, but engagement quality, sentiment, and long-term brand equity signals. Attention measurement as a complementary quality lens
The dream outcome is a brand that can be culturally alive without being reckless. That’s what measuring social media engagement is supposed to unlock: content that earns attention, community that feels heard, and growth that doesn’t depend on guessing where the line is. A look at how Duolingo operationalized rapid creative iteration
Professional Promotion
This section isn’t about promoting a product. It’s about promoting your analytics work so it actually influences decisions. Great measurement can still fail if nobody trusts it, understands it, or feels motivated to act on it.
Build A One-Page Story People Want To Repeat
Turn your engagement report into a short narrative with four parts: what changed, why it changed, what it means, and what you’ll do next. Keep the headline metric consistent, then support it with a small number of depth signals (shares/saves/DMs) and intent signals (clicks or conversions). This is how you make “measure social media engagement” sound like strategy instead of analytics.
Make Response Time A Visible Win For The Team
If you want leadership to fund community management and tools, show response time next to outcomes. Many consumers expect replies within 24 hours or sooner, and a meaningful portion expect replies within an hour, which means speed can be positioned as a competitive advantage, not a cost center. Sprout Social on 24-hour response expectations Emplifi on one-hour DM expectations MarketingCharts on response-time expectations
Use Benchmarks As Guardrails, Not Goals
Benchmarks are most persuasive when they frame risk: “we’re above the baseline and should scale this,” or “we’re below the baseline and need to diagnose distribution vs creative.” Use benchmark sources that are recent and explicit about methodology, and always explain the denominator so stakeholders don’t misinterpret the number. Hootsuite benchmarks methodology and platform context Emplifi benchmarks with reach-based engagement context
End With Commitments, Not Observations
Promoting your measurement work means making it actionable. Finish every report with three commitments: one thing you will repeat because it worked, one thing you will stop because it didn’t, and one test you’ll run because the data suggests an opportunity. When the report ends in action, your engagement measurement becomes the engine of creative improvement instead of a monthly recap.
Advanced Strategies
Once you have a stable baseline, the next level is not “more dashboards.” It’s smarter questions. Advanced work to measure social media engagement is about separating what looks good from what actually causes outcomes, and then building a system that can scale without turning into chaos.
Build A Depth-Weighted Engagement Index
A single engagement rate can be useful for trending, but it’s a blunt tool for optimization. A depth-weighted index fixes that by treating different interactions as different levels of intent: likes as lightweight, comments/replies as conversational, saves/shares as utility and endorsement, and DMs/clicks as action-oriented.
This matters more in 2025–2026 because engagement is becoming more private, with saves, shares, and DMs rising in importance even when public interactions don’t grow at the same pace. Buffer’s analysis of private engagement signals
Add Attention Signals, Not Just Interactions
Some content earns a reaction without earning attention. If you’re serious about measuring content quality, pair your interaction metrics with attention metrics like watch time, completion rate, and retention curves—especially for short-form video where the platform’s ranking systems are deeply tied to viewing behavior.
On video-heavy channels, this approach is easier to operationalize because platforms publish clearer measurement definitions for engagement and retention. YouTube Analytics metrics definitions Broader measurement standards are also pushing toward attention quality as a complementary lens, which helps teams justify why “less visible” engagement can still be more valuable. IAB/MRC attention measurement guidance
Measure Responsiveness As An Engagement Lever
If your brand receives DMs, tags, and comments at scale, response time isn’t a customer service metric—it’s an engagement metric. Many consumers now expect quick replies, and one of the clearest patterns across recent research is the “DM within an hour” expectation becoming common enough that slow responses can visibly erode loyalty and conversions. Emplifi’s 2025 consumer-brand survey on one-hour DM expectations MarketingCharts summary of the same DM response expectation Sprinklr’s 2025–2026 brand monitoring guide referencing the same response-time pressure
Practically, track response time by channel and by intent type (complaints, sales questions, product questions). Then correlate it with repeat engagement, sentiment, and conversions in the weeks where responsiveness improves.
Use Incrementality When The Stakes Are High
At some point, you’ll hit the ceiling of correlation. This is where incrementality comes in: experiments that tell you what happened because of your marketing, not just what got credit.
- Conversion lift tests: Randomized holdout experiments that isolate causal impact. Meta Conversion Lift overview
- Platform experiments: Incrementality experiments are becoming easier to run at lower spend thresholds, which makes causal measurement more accessible for more teams. Google Ads updates on more accessible incrementality testing Google Ads announcements on incrementality experiments
- Geo experiments: Region-based tests that are especially useful when you can’t randomize user-level exposure cleanly. Geo experiments guide and fundamentals
When you measure social media engagement in an advanced way, engagement becomes an early signal, and incrementality becomes the proof that your signal is translating into outcomes.
Scaling Framework
Scaling doesn’t mean posting more. It means building a repeatable machine where measurement stays reliable as volume rises, teams multiply, and platforms change their reporting.
Standardize The Measurement Layer, Then Localize The Creative Layer
As you scale, the biggest threat is definition drift: different teams using different formulas and then debating whose numbers are “real.” Solve this by standardizing the measurement layer (definitions, denominators, naming rules, tagging) and leaving the creative layer flexible so content can stay native to each channel and audience segment.
Platform reporting changes are a real operational risk, not a theoretical one, so scaling requires a simple habit of monitoring changes and auditing metrics on a recurring cadence. Example of platform metric changes impacting reporting
Build A Content Taxonomy You Can Query
A scaling taxonomy makes your reporting smarter automatically. Tag content by format, intent, hook style, creative theme, product line, campaign, and audience. The real benefit is that you can answer questions like “what kind of content drives saves in our highest-LTV segment” without manually reclassifying posts every month.
Invest In A Single Reporting Layer
Scaling teams don’t scale spreadsheets. If you need reliability, consolidate reporting in a system that can ingest data consistently and present a single version of the truth. For businesses that tie social engagement to on-site behavior, exporting analytics events into a warehouse is a common path to durable analysis. GA4 BigQuery export setup
Growth Optimization
Growth optimization is where measurement becomes a growth engine. It’s not about reporting engagement after the fact; it’s about using engagement to decide what to build next.
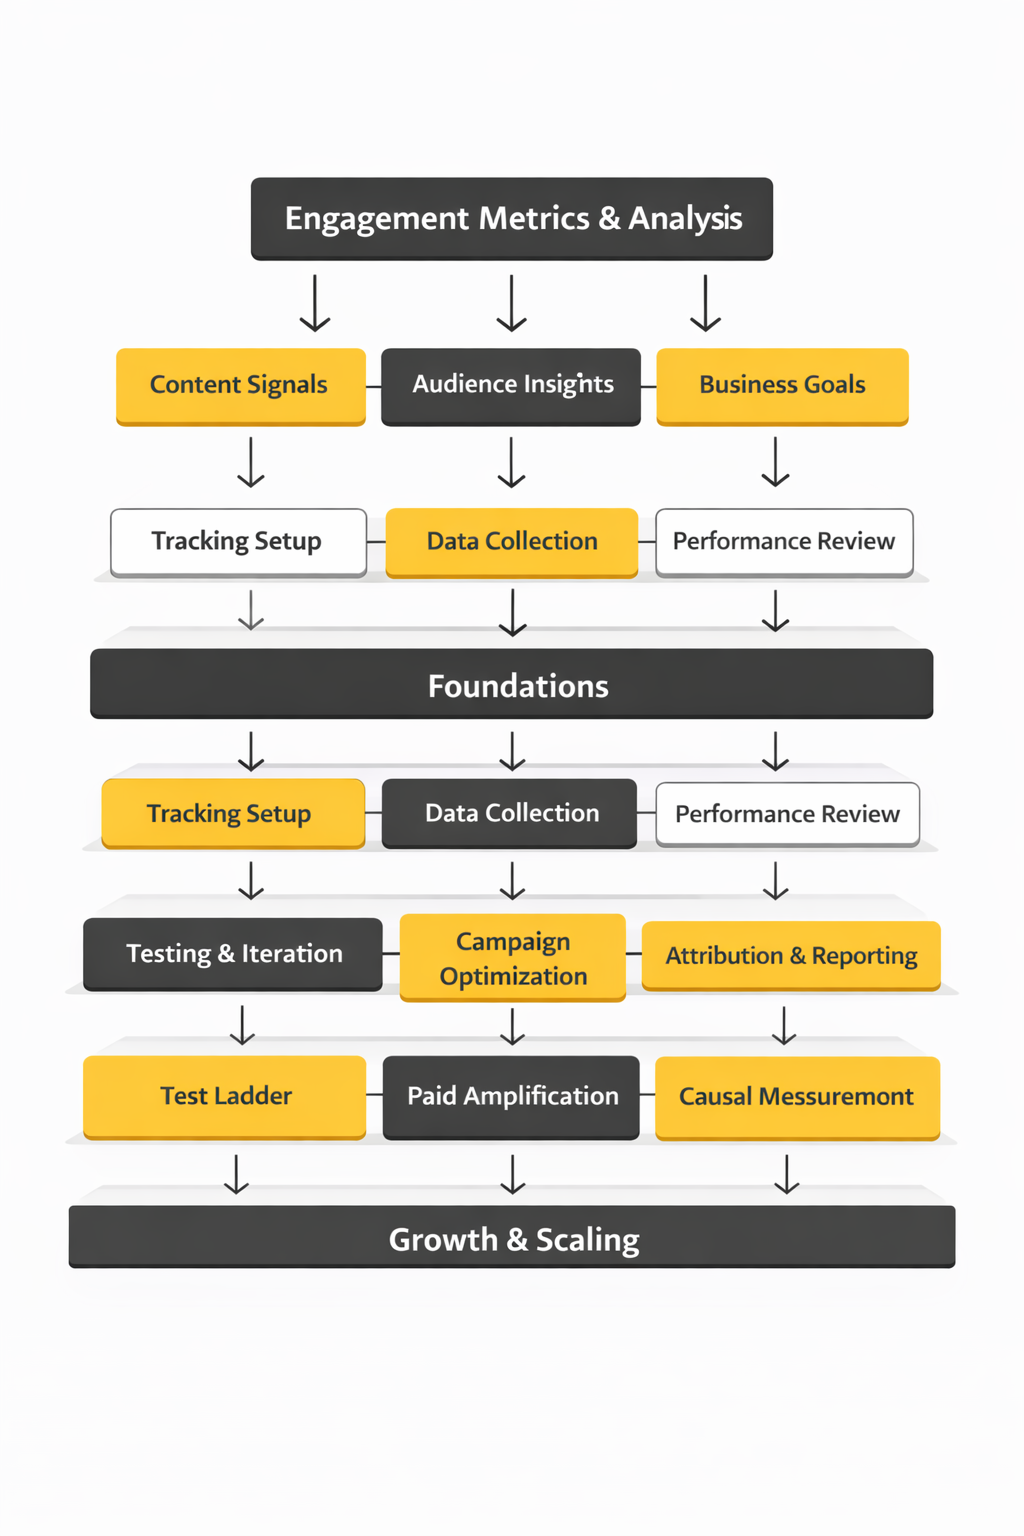
Build A Test Ladder From Low-Risk To High-Risk
Start with low-risk creative tests (hooks, captions, thumbnails, CTA placement), then move into higher-risk distribution tests (posting windows, format mix, paid amplification rules), and only then into high-risk measurement tests (lift studies, geo tests, incrementality experiments). This ladder keeps you learning continuously without betting the quarter on one experiment.
Scale Winners With Clear Paid Amplification Rules
When a post earns deep engagement quickly—saves, shares, meaningful comments, DMs—it’s often a candidate for amplification. The key is making the rule explicit, like “amplify when the depth-weighted index is above baseline within 6–12 hours and retention stays stable.” This avoids the common trap of boosting whatever got the most likes, which can inflate vanity results without improving outcomes.
Link Engagement To Business Impact With Causal Measurement
When a team is scaling spend, stakeholders eventually ask the hardest question: did this cause incremental outcomes, or did it just get credit? This is where lift tests become useful, because they measure causal impact by comparing exposed and holdout groups. Meta’s Conversion Lift testing approach TikTok’s Conversion Lift Study is positioned similarly as an incrementality-based measurement approach for proving impact beyond attribution. TikTok Conversion Lift Study overview
Scaling Stories
Scaling measurement is rarely a tidy project plan. It usually starts with pressure, embarrassment, or a moment where the old way of reporting can’t survive a real decision.
Gruvi: Proving Impact When “Engagement” Wasn’t Enough
It began with the kind of tension that makes marketing teams go quiet in meetings. The campaign looked strong in-platform, the creative was getting attention, and the stakeholders still didn’t believe it was moving the business. When the numbers are “good” but nobody trusts them, you don’t have a performance problem—you have a measurement credibility problem. Gruvi’s Meta success story
The backstory was a familiar gap between social metrics and decision metrics. Social was producing engagement and driving behavior that didn’t always show up cleanly in last-click reporting. The team needed a way to show impact that didn’t depend on attribution models that miss view-through and cross-channel effects. How Conversion Lift is positioned for incremental impact measurement
The wall hit when they realized the dashboard couldn’t answer the only question that mattered: what happened because of the ads? That’s the moment where “measure social media engagement” stops meaning “track interactions” and starts meaning “prove causality.” They needed an approach that could separate correlation from impact. Why incrementality is framed as causal impact in modern measurement updates
The epiphany was that experimentation could make the argument for them. Instead of debating attribution windows, they used a lift approach designed to estimate incrementality through controlled comparison. It shifted the conversation from “our engagement is up” to “our ads caused measurable additional behavior.” Conversion Lift overview for causal measurement
The journey was operational, not theoretical. They had to design the test window, align stakeholders on what “success” meant, and run measurement alongside creative iteration so the learning could feed back into content decisions. The effort wasn’t just analytics; it was cross-team coordination so the measurement could actually be trusted. Gruvi’s measurement approach described in the success story
The final conflict showed up the way it usually does with real experiments: reality doesn’t always flatter the narrative. Lift tests can reveal that something you believed was “working” was mostly capturing demand that would have happened anyway. That moment stings, but it’s also where optimization becomes profitable instead of performative. Why incrementality is framed as “true business impact” rather than attribution
The dream outcome is a team that can scale with confidence. Once you can prove incremental impact, you can make budget decisions faster, defend creative bets, and stop wasting time arguing about which dashboard is “right.” That’s what scaling measurement is really for: getting out of debate and into action. Meta’s positioning of lift as decision-grade measurement
Sell A System, Not A Report
Clients don’t stay for charts—they stay for decisions that improve results. Position your engagement measurement as a system that creates a monthly cycle of insights and action, and make the deliverable a short, repeatable set of decisions: what to scale, what to stop, and what to test next.
Make Private Engagement Visible And Valuable
Many clients still judge performance by likes because that’s what they can see. Your advantage is showing the invisible layer: saves, shares, DMs, and response time. Research and platform commentary increasingly point to private and intent-heavy engagement as a growing part of how people interact with brands, even when public metrics don’t surge. Buffer on private engagement becoming more important Emplifi on rapid-response expectations shaping loyalty
Add One Causal Proof Point Per Quarter
When a client is ready to scale spend, introduce one causal measurement project per quarter: a lift test, a geo test, or a structured incrementality experiment. The point isn’t to run experiments constantly—it’s to create periodic proof that your engagement gains aren’t just noise, but are tied to incremental business outcomes. Conversion Lift for incrementality measurement TikTok Conversion Lift Study
Future Trends
The next wave of social performance won’t be won by posting more. It will be won by teams who measure social media engagement in ways that match how people actually behave now: more private sharing, more messaging, more “quiet” intent signals, and more pressure to prove business impact.
One of the clearest shifts is where engagement lives. Platforms are openly acknowledging that a growing share of meaningful interaction happens through messaging and private sharing rather than public likes and comments, which is why “shareable content” is being treated like a ranking advantage. How creators are optimizing for DMs and shares on Instagram Why Snapchat and Instagram are chasing private conversations
That shift changes measurement. If your dashboard mostly tracks public engagement, you’ll miss the signals that increasingly predict outcomes: shares, saves, replies, and inbound DMs. The practical trend is simple: your “engagement” definition has to expand, or your strategy will quietly fall behind.
At the same time, measurement standards are evolving beyond delivery and into quality. Attention metrics are moving from a niche topic into an operational concept, with industry bodies publishing guidelines and playbooks designed for marketers who need a framework they can actually use. IAB and MRC attention measurement guidelines (Nov 2025) CIMM and IAB attention measurement playbook (Nov 2025)
Finally, expectations for responsiveness are rising fast enough that they’re becoming a competitive wedge. When roughly one-third of consumers expect a DM response within an hour and only a small minority are willing to wait two days, response time stops being a “nice to have” and starts acting like a measurable engagement driver. Consumer expectations for DM response speed A quick summary of the same DM response expectation
Strategic Framework Recap
If you want a framework that stays stable through algorithm shifts and reporting changes, keep coming back to one idea: measure social media engagement as a system that connects content signals to business decisions.
- Define engagement in plain language: What actions matter for your brand (public interactions, saves, shares, DMs, clicks, retention) and why.
- Standardize your formulas: Pick a primary engagement rate denominator and keep it stable so trends mean something.
- Track engagement depth: Treat likes as lightweight signals, and treat saves, shares, replies, and DMs as stronger intent signals.
- Add attention signals where it matters: For video-heavy content, watch time and retention often explain performance better than reactions alone. YouTube engagement and retention metric definitions
- Connect engagement to outcomes: Use consistent campaign tracking so you can link engagement to what happens next. UTM parameters and campaign tracking
- Build credibility through governance: Monitor reporting changes and reconcile key metrics so your numbers stay trustworthy over time. How platform metric changes can affect reporting
This is the difference between “we got more likes” and “we can predict what will work next month.” It’s also the difference between a report that gets skimmed and a report that changes what your team does.
FAQ – Built For A Complete Guide
What does it mean to measure social media engagement?
It means tracking how people interact with your content (likes, comments, shares, saves, replies, clicks, watch behavior) and interpreting those actions in context so you can make decisions. The goal isn’t collecting numbers. The goal is understanding what your audience found valuable enough to react to, share, or act on.
What is the best engagement rate formula to use?
The best formula is the one you can keep consistent. Many teams use engagement per reach for organic and engagement per impressions for paid comparisons, but consistency matters more than perfection. Pick one primary formula for trend reporting and keep it stable for at least a full quarter.
Why do saves and shares matter more than likes?
Saves and shares usually signal stronger intent. A save suggests future value (“I want this later”). A share suggests endorsement (“someone else should see this”). As platforms lean into private sharing and messaging, these quieter signals become more predictive of meaningful impact than public likes alone. Why creators chase private shares and DMs
How can I measure private engagement like DMs if it’s not fully visible?
Track the signals you can access consistently: inbound message volume, reply rate, median response time, and clicks from “message” CTAs where available. Then treat these as first-class metrics in your reporting, not “extra notes.” Consumer expectations for fast responses make responsiveness a measurable performance lever. DM response-time expectations
What response time should brands aim for on social?
For many brands, the most competitive target is “same day,” with a meaningful share of consumers expecting a DM reply within an hour. If you can’t hit that in all hours, measure it by business hours and build a clear service level target your team can actually maintain. Response-time expectation snapshot
What video engagement metrics matter most?
For video, prioritize watch time and retention patterns because they show whether viewers stayed, not just whether they tapped like. If your content is short-form, completion rate and average view duration tend to explain performance more reliably than reactions alone. Video engagement and retention definitions
How should I use engagement benchmarks without getting misled?
Use benchmarks as guardrails. Only compare your results to sources that use a comparable methodology, and avoid mixing denominators. If your engagement rate is calculated by reach, don’t compare it to a per-follower benchmark without adjusting your interpretation.
Why do engagement numbers change even when content quality stays the same?
Distribution changes. Platforms shift ranking priorities, audiences migrate toward different content types, and engagement moves into private spaces. That’s why interpreting engagement requires checking reach/impressions first, then attention, then intent signals. How platform product shifts follow behavior shifts
How often should I report engagement metrics?
Weekly is best for creative diagnostics and fast iteration. Monthly is best for trend clarity and stakeholder reporting. Quarterly is best for audits: checking metric definitions, refreshing benchmarks, and validating that tool outputs still match platform reporting.
When should I run lift tests or incrementality experiments?
When budget decisions get serious and correlation isn’t enough. Lift tests help answer “what happened because of our marketing” by using controlled comparison rather than attribution guesswork. They’re especially valuable when social engagement is high but last-click reporting can’t capture the full story. Conversion lift measurement overview
Work With Professionals
Once you know how to measure social media engagement properly, you start seeing a pattern: most teams don’t fail because they lack effort. They fail because they don’t have a clean system, and that makes it hard to prove results, improve fast, or win budget.
If you’re a marketing freelancer, that same truth becomes your advantage. Companies are overwhelmed by shifting platforms, private engagement, and measurement pressure. They need someone who can walk in, stabilize the data, and turn messy performance into decisions they can trust.
That’s exactly where MARKEWORK.com fits. It’s built to help marketers and companies connect directly, without project fees or commissions, so you keep control of your work and your earnings. No commissions and no project fees Direct communication without a middle layer
Instead of fighting for attention on generic job boards, you can position yourself as the person who brings clarity: you measure what matters, you build a repeatable reporting loop, and you help teams move from “we posted” to “we grew.”
And when you’re ready to turn that skill into a steady pipeline, the platform is designed for momentum: build a profile that shows proof and pricing, browse marketing-focused listings, and talk to companies directly so you can close work faster. How MARKEWORK.com is positioned for marketers and companies Access to thousands of job listings with simple monthly plans
