“How much will it cost?” sounds like a simple question—until you realize social ad pricing is a live auction that changes by the second. The same creative can be cheap on Tuesday, expensive on Friday, and wildly different across countries, placements, and objectives.
This guide treats social media advertising cost like a system you can model and manage. You’ll learn what you’re actually paying for, why costs swing, and a framework you can use to plan budgets, forecast results, and avoid the most common ways advertisers accidentally overpay.
Article Outline
- What Is Social Media Advertising Cost?
- Why Social Media Advertising Cost Matters
- Framework Overview
- Core Components
- Professional Implementation
What Is Social Media Advertising Cost?
Social media advertising cost is the price you pay to buy attention and actions inside a platform’s ad auction. In practice, you’re paying for one of a few outcomes: impressions (CPM), clicks (CPC), views (CPV), leads (CPL), or conversions (CPA). The platform decides how to spend your budget across people and placements to hit the objective you selected.
That’s why “average cost” numbers can be misleading. Your cost is not a menu price—it’s the result of a competition where your targeting, creative quality, and conversion signals fight for the same limited inventory as everyone else. LinkedIn is explicit that its auction weighs both bid price and relevancy when deciding which ad wins, and that concept is broadly shared across major platforms.
The cleanest way to think about social media advertising cost is this: you control the inputs (goal, audience, creative, budget, bid strategy, tracking), and the platform returns an output (delivery and results) at a market price that moves with competition and user behavior.
Why Social Media Advertising Cost Matters
Cost isn’t just a finance line—it’s a strategy constraint. If you don’t understand what drives social media advertising cost, you’ll misread performance and “optimize” in ways that look good in-platform but quietly destroy profitability.
One reason the stakes are high is that social ad budgets are flowing back aggressively. The U.S. market alone logged $88.8B in social media advertising revenue in 2024, highlighting how crowded auctions can become when brands pile into the same feeds with the same objectives.
Cost also shapes creative and measurement decisions. When inventory expands, prices can soften; when competition spikes or targeting tightens, costs rise. Tinuiti’s benchmarking shows how quickly market conditions can flip: Meta impressions rose 16% year over year in Q3 2025 while CPM fell 2%, largely reflecting changing inventory dynamics and demand patterns.
Most importantly, cost is the bridge between marketing activity and business reality. If you can predict and control cost drivers, you can plan cash flow, set realistic CPA targets, choose the right objective, and scale spend without gambling.
Framework Overview
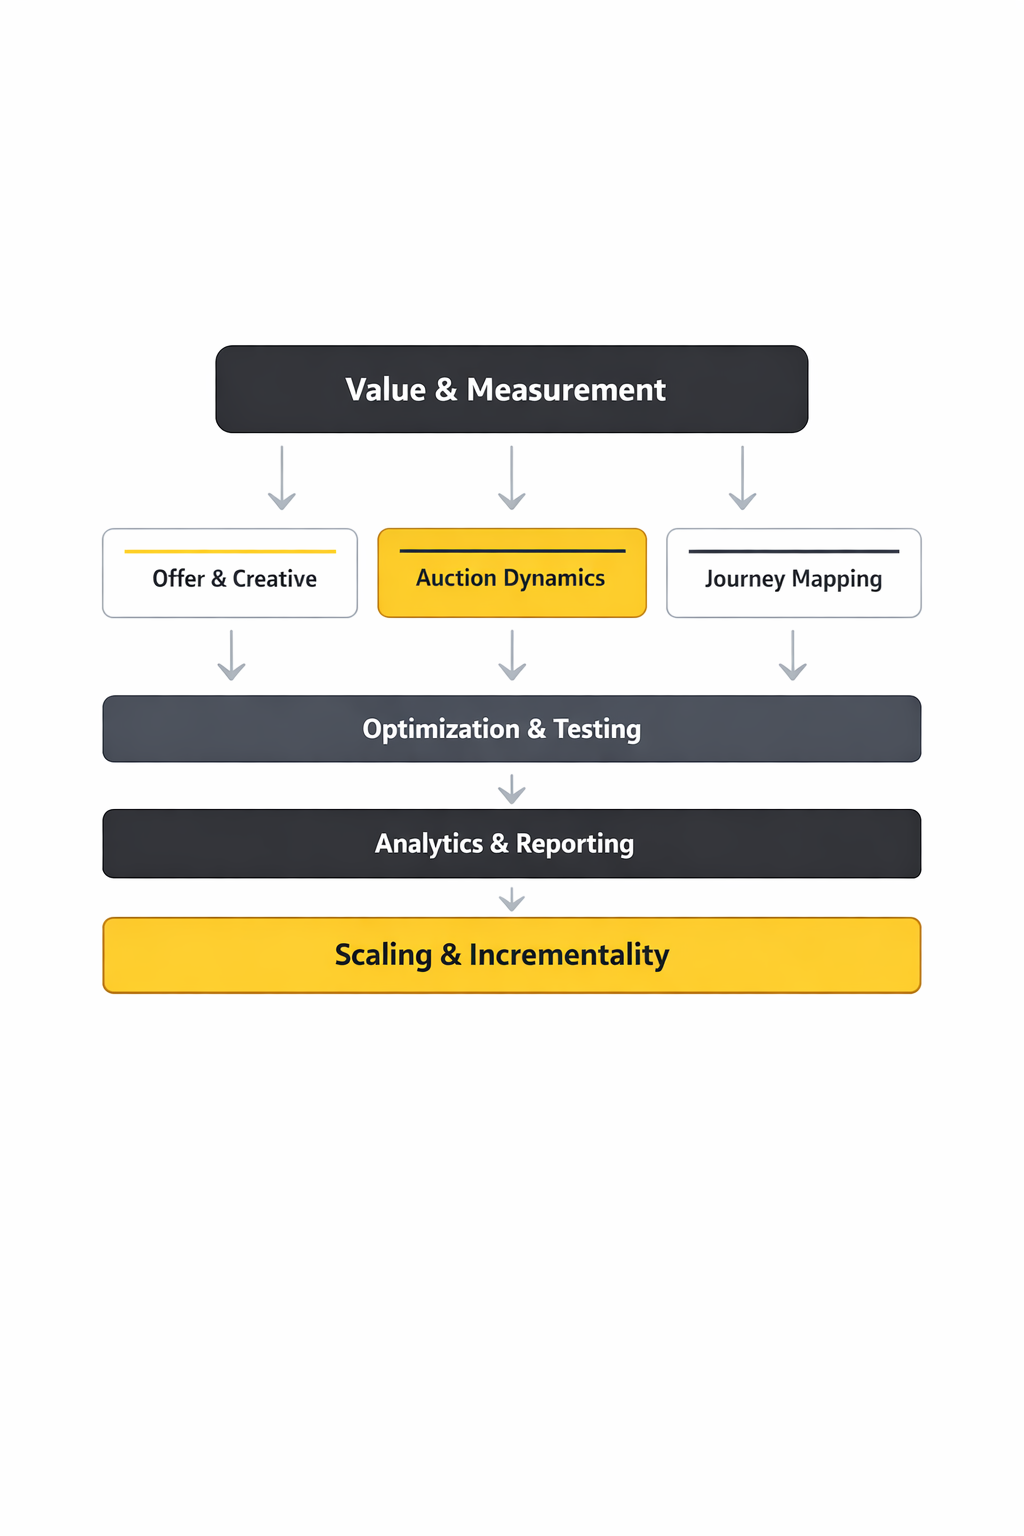
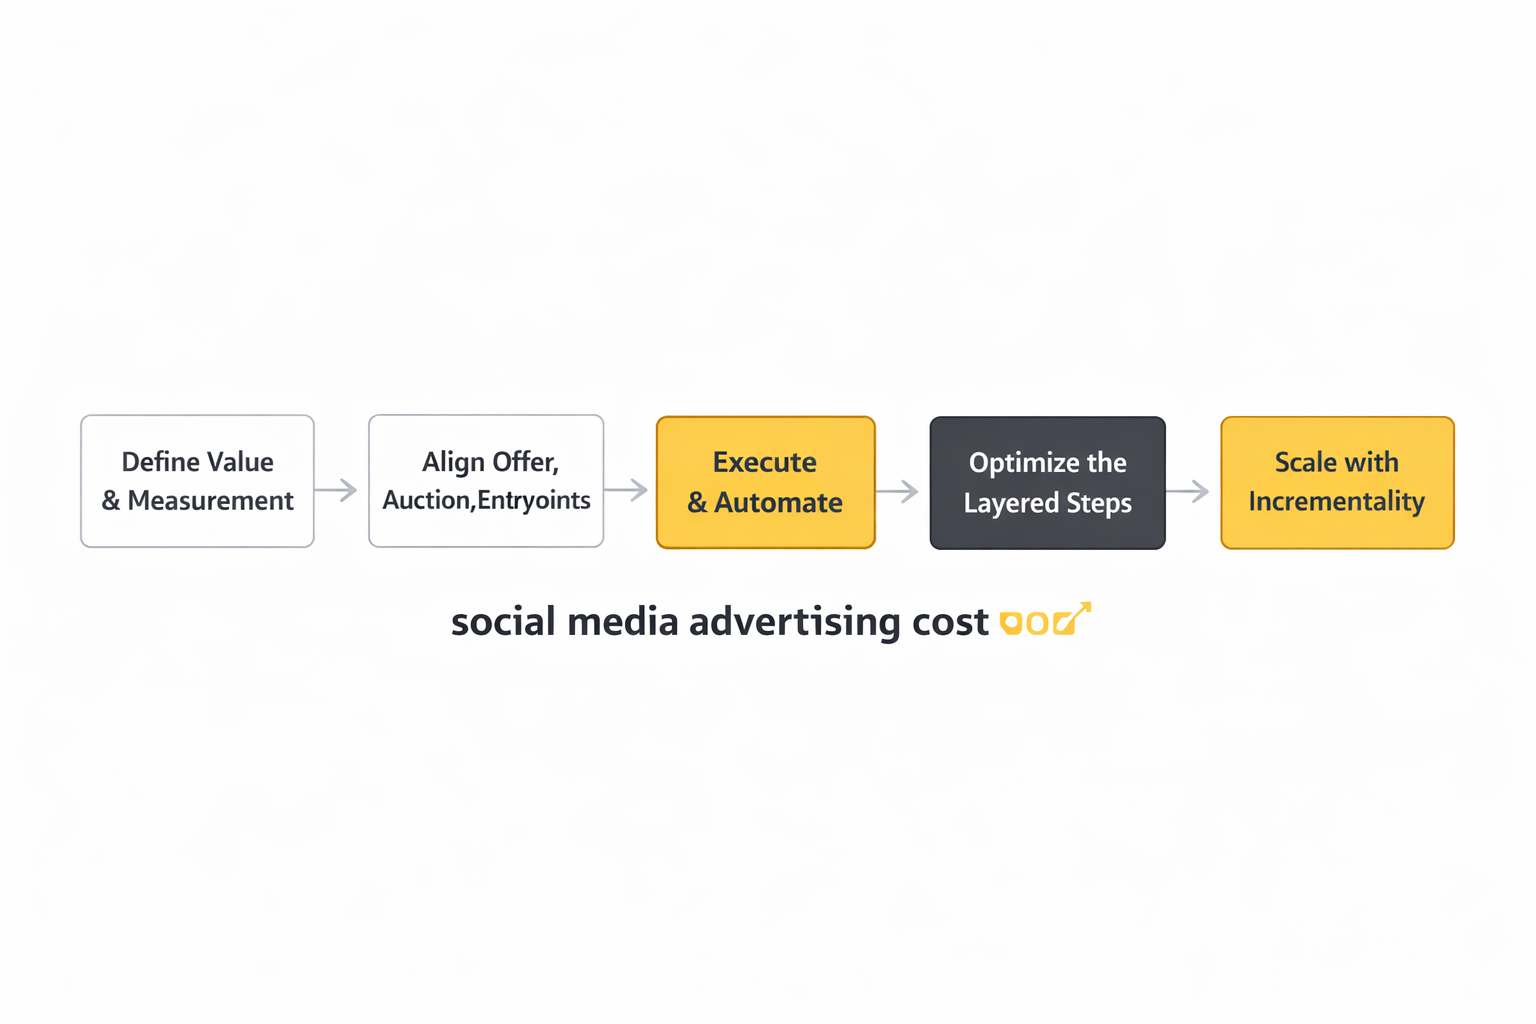
This framework treats social media advertising cost as a loop you can run repeatedly: define value, shape demand, win auctions efficiently, then feed learning back into the next cycle. The goal isn’t to chase “cheap clicks.” It’s to buy the right outcomes at a price your business can afford, and to know which lever to pull when costs change.
Step 1: Define value. Start with what a result is worth (lead value, conversion value, margin). If you can’t express value, you’ll end up arguing about CPMs instead of profit.
Step 2: Choose the buying model. Pick the objective that matches your real goal (sales, leads, traffic, views). This sets what the algorithm optimizes for, which heavily influences cost behavior.
Step 3: Enter the auction with leverage. Your bid strategy, targeting breadth, and creative relevance determine whether you win auctions at a sane price. Platforms like Meta describe their process as an ad auction where multiple factors determine delivery, not simply the highest bid.
Step 4: Measure what the business needs. Platform reporting is necessary, but it’s not the finish line. The loop only works if your tracking can connect spend to real outcomes—otherwise you’ll optimize toward noisy proxy metrics.
Step 5: Iterate. Costs drift because the market drifts. Your job is to spot whether cost changes are coming from competition, creative fatigue, tracking quality, or offer weakness—and respond with the right fix.
Core Components
1) Pricing Models: What You’re Actually Buying
Most advertisers talk about social media advertising cost as CPM or CPC, but those are just billing units. What matters is the effective cost per meaningful outcome.
If you buy impressions (CPM), your hidden variable is click-through rate and conversion rate. If you buy clicks (CPC), your hidden variable is landing page performance and lead quality. If you buy conversions (CPA), your hidden variable is tracking quality and how accurately the platform can identify likely converters.
The same campaign can look “cheaper” in one pricing model while being more expensive in profit terms. That’s why cost discussions must start with what outcome you need and how reliably it can be measured.
2) Auction Levers: Bid, Quality, and Expected Action
Social platforms don’t just sell inventory—they try to protect user experience while maximizing revenue. In other words, your ad competes on more than money.
LinkedIn explains this plainly: its auction is designed to maximize value for members and advertisers, and it considers bid price and ad relevancy. Practically, “relevancy” shows up as creative resonance, landing page consistency, and early performance signals that suggest users will take the action you’re optimizing for.
This is why two advertisers can target the same audience and get very different costs. The better offer and creative can win auctions more often and still pay less per result because the platform predicts a stronger outcome.
3) Targeting Breadth vs. Inventory Pressure
Tight targeting feels safe, but it often raises social media advertising cost by forcing your ad into smaller, more competitive pockets of inventory. Broad targeting gives the algorithm room to find cheaper opportunities—if your creative and tracking are strong enough to guide it.
Inventory changes matter too. When platforms add supply (new placements, more video inventory, new surfaces), costs can soften; when supply shrinks or demand spikes, costs rise. The Tinuiti benchmarks showing impressions up while CPM fell are a good reminder that cost is often an inventory story as much as a creative story.
4) Budget Minimums and Delivery Guardrails
Minimum budgets don’t just exist to be annoying—they shape how quickly the algorithm can learn. If spend is too low, delivery can be unstable and results noisy, which makes “cost” look random.
Some platforms publish hard minimums. TikTok’s help center lists minimum thresholds, including $50 at the campaign level and $20 at the ad group level, to maintain delivery stability. Those numbers don’t guarantee performance, but they do signal that ultra-low budgets often struggle to exit the learning phase cleanly.
5) Measurement and Signal Quality
When tracking is weak, the platform can’t optimize well—and social media advertising cost rises because the algorithm is effectively guessing. Poor event setup, broken UTMs, mismatched conversion windows, or delayed lead feedback all reduce signal quality.
In cost terms, signal quality is a multiplier: strong signals let the system find cheaper conversions faster; weak signals force it to spend more to “discover” what works. If you’ve ever seen costs suddenly spike after a tracking change, this is usually why.
6) Creative Fatigue and Refresh Rate
Even great ads get expensive when they get stale. As frequency rises, performance often drops, and the auction demands more money to keep the same volume of results. The fix is rarely “tweak the bid.” It’s usually creative variety, sharper hooks, clearer offers, and faster iteration cycles.
Professional Implementation
Step 1: Set Cost Guardrails Based on Real Unit Economics
Before touching Ads Manager, write down three numbers: your break-even CPA, your target CPA, and the maximum daily spend you can afford while learning. These guardrails stop you from optimizing emotionally when results fluctuate.
If you’re selling products, base this on contribution margin after shipping, payment fees, and returns. If you’re generating leads, base it on close rate and the profit per closed deal. This is the difference between “we got leads” and “we got profitable customers.”
Step 2: Pick an Objective and Bidding Approach That Matches Reality
If you need sales, optimize for sales. If you need qualified leads, optimize for leads and build qualification into the funnel. Objectives are not cosmetic—they decide what the algorithm values.
On platforms where supply is limited and competition is intense, your bidding approach matters even more. LinkedIn’s own resources emphasize that campaigns compete in auctions and that your bid strategy influences delivery through bidding options like manual bidding and cost caps.
Step 3: Build a Testing Map That Protects Budget
Professionals don’t test randomly—they test in layers. First validate the offer and message, then validate the audience, then scale spend. If you test everything at once, you never learn what caused the cost change.
A simple testing map:
- Creative tests: new hooks, formats, angles, and proof points.
- Audience structure tests: broad vs. interest vs. lookalike (where available), keeping creatives constant.
- Funnel tests: landing page speed, message match, form friction, and follow-up speed.
Step 4: Watch the Right Metrics at the Right Time
Early on, you need diagnostic metrics (CTR, CPC, CPM, frequency) to understand auction behavior. Later, you need business metrics (CPA, cost per qualified lead, profit per purchase, payback period) to decide whether to scale.
If you only watch platform metrics, you can “win” the dashboard while losing money. If you only watch CPA too early, you can kill campaigns before the algorithm stabilizes. Cost control is about timing: knowing which metric is signal now, and which is noise.
Step 5: Create a Cost Response Playbook
When social media advertising cost rises, don’t guess—diagnose. Use a simple decision path:
- CPM up: competition/inventory shift, audience too tight, or relevance dropping.
- CPC up but CPM stable: creative or offer is weaker; message match is off.
- CPA up while CPC stable: landing page, checkout, lead quality, or tracking signals degraded.
This keeps you from making expensive “fixes” that don’t address the real cause.
Step-by-Step Implementation
Most teams try to “optimize” social media advertising cost before they’ve built the foundation that makes optimization real. The step-by-step below is the order professionals follow when they want costs that stay stable through seasonality, privacy changes, and creative fatigue.
It’s not glamorous, but it works because each step reduces uncertainty. Less uncertainty means the algorithm learns faster, reporting becomes less arguable, and budget decisions stop being guesswork.
If you already have campaigns running, you can still implement this in parallel. The key is to treat it like a rollout: lock definitions, build signal quality, then scale.
Step 1: Define success in business language
Write down what a “win” means before you open Ads Manager. Not “more traffic,” but the event that matters: a purchase, a booked call, a trial-to-paid conversion, a qualified lead that moves pipeline.
Then decide what that win is worth. Social media advertising cost only becomes controllable when you know your ceiling—because your ceiling tells you when to push harder and when to stop.
This step also forces a hard decision: which conversions are “learning signals” and which conversions are “reporting outcomes.” When teams mix those up, they often pay more over time because the algorithm is trained on the wrong thing.
Step 2: Build a clean event taxonomy and ownership
Create a short list of events you’ll use across every platform. Keep the names consistent, keep the parameters consistent, and assign an owner who’s responsible for keeping those events accurate after site changes.
This is where most measurement setups quietly break. A product team ships a new checkout, a form field changes, or a thank-you page gets removed—and suddenly your social media advertising cost climbs because optimization is working with partial data.
When in doubt, choose fewer events and make them flawless. Reliable events beat a long list of “maybe” signals every time.
Step 3: Instrument collection in a way that survives reality
Start with a well-managed client-side implementation, then add server-side collection where signal loss is clearly costing you. Google’s overview of server-side Tag Manager explains why teams move tags off the browser and into a controlled server environment in this server-side tagging guide.
For TikTok, identity-safe matching is explicitly part of improving measurement and optimization. TikTok describes how customer information can be hashed (SHA-256) and used for better matching in Advanced Matching for Web, and provides implementation direction in its Events API overview.
The point isn’t to chase a “tracking hack.” It’s to make sure your best conversion signals actually reach the platform consistently, so the auction doesn’t get more expensive just because your data got noisier.
Step 4: Connect CRM outcomes when lead quality matters
If you generate leads, you’re not really buying leads—you’re buying the chance of revenue. That’s why professional teams push deeper-funnel outcomes back into the platforms, so optimization learns what “good” looks like.
LinkedIn’s product roadmap is built around this idea. Their documentation and updates make it clear that qualified lead data sent through Conversions API can power lead-quality optimization, including the MAX_QUALIFIED_LEAD optimization target.
When you close the loop, social media advertising cost becomes less sensitive to cheap-but-low-quality traffic, because the algorithm is trained to value what your sales team values.
Step 5: Build a single source of truth for spend vs outcomes
Use platform dashboards for in-platform decisions, but centralize the “truth” somewhere you can join spend to revenue and lifecycle stage. That might be GA4 + a warehouse, or a warehouse-first setup.
The goal is simple: if the CFO asked why costs rose this month, you can answer without hand-waving. And if a platform claims success, you can validate it with downstream business data.
Once you have that, you’re finally ready for the part everyone wants to start with: optimization.
Execution Layers
Execution is where social media advertising cost gets won or lost. Not in a single setting, but across layers that compound—creative affects click behavior, landing pages affect conversion rates, measurement affects algorithm confidence, and bidding affects where you show up in the auction.
When costs rise, teams often stare at one layer (usually bids) and ignore the one that actually broke (often creative or signal quality). The structure below helps you diagnose where the problem really lives.
Think of it like a stack: if the lower layers are unstable, higher-layer “optimizations” turn into expensive guesswork.
Layer 1: Offer and funnel mechanics
This is the layer most dashboards can’t show you clearly: the attractiveness of your offer and the friction in the journey. If people click but don’t convert, you’ll pay more—either through higher CPC (because engagement drops) or higher CPA (because fewer clicks become outcomes).
Professionals treat landing pages, forms, and follow-up speed as part of social media advertising cost control. If a lead form is too easy, you’ll buy low-intent leads; if it’s too hard, your CPL rises. The “right” balance depends on what your sales team can handle and what your margins demand.
Fixing this layer often lowers costs without touching ads—because it raises conversion rates, which raises the amount you can afford to bid while staying profitable.
Layer 2: Creative system and refresh cadence
Creative isn’t an asset; it’s a system. If you ship one “winning ad” and ride it until it dies, your social media advertising cost will drift upward as fatigue sets in.
The professional approach is a pipeline: constant new hooks, new proof, new formats, and new angles—while keeping the offer and tracking stable so you can interpret results.
This is also where teams earn leverage in auctions. When creative relevance is strong, you can often win more impressions without increasing bids, because user response improves delivery efficiency.
Layer 3: Targeting and campaign structure
Structure is how you tell the platform what to optimize for and how to explore. Over-segmentation can make learning slow and expensive; overly broad setups can work brilliantly, but only when your signals and creative are strong enough to guide the algorithm.
When you’re controlling social media advertising cost, you’re choosing structure based on learning speed. If you need faster learning, consolidate. If you need clearer insights, isolate tests—but do it intentionally so you don’t starve the system of data.
This layer is also where you enforce guardrails: exclusions, frequency management, and budget pacing rules that prevent runaway spend when performance is volatile.
Layer 4: Measurement and signal quality
Signal quality changes how confidently platforms bid on your behalf. LinkedIn has publicly shared that Conversions API usage is associated with better attribution and efficiency outcomes, including an average lift in attributed conversions and reductions in cost per action, and their Conversions API materials expand on that pattern in the Conversions API playbook.
That doesn’t mean “install CAPI and profit.” It means that when the data is cleaner and more complete, optimization has a better chance of finding the right people at a sustainable price.
If this layer is weak, everything above it becomes harder. You can still win, but you’ll often pay more to do it.
Layer 5: Bidding and budgeting decisions
Bidding is the layer everyone wants to tweak first, but it’s usually the last layer you adjust after you’ve ensured the stack above it is healthy.
Use bid controls to enforce discipline, not to compensate for broken fundamentals. Meta’s own overview of bid strategies helps clarify the tradeoffs between cost controls and delivery flexibility in its bid strategy guide.
When the other layers are working, this layer becomes simpler: scale what’s profitable, cap what’s uncertain, and give learning enough budget to stabilize before you judge it.
Optimization Process
Optimization that truly reduces social media advertising cost looks less like “tweaking” and more like a rhythm. You diagnose what moved, you change one lever that matches the diagnosis, and you track whether the change improved business outcomes—not just platform metrics.
The process below is built to prevent the most expensive mistake in paid social: changing five things at once, seeing performance shift, and having no idea why.
Follow the sequence, and cost swings become debuggable instead of mysterious.
1) Establish baselines you actually trust
Pick a stable time window and lock a baseline for: CPM, CTR, CVR, CPA (or CPL), and the downstream metric that matters (qualified rate, revenue per lead, margin per order). Baselines are your early warning system.
If baselines are shifting because tracking is inconsistent, fix tracking before you “optimize.” Otherwise you’ll end up spending time—and money—chasing ghosts.
This is where a reliable signal pipeline pays for itself: it reduces false alarms and keeps your decision-making anchored in reality.
2) Diagnose cost moves with a simple cause map
When social media advertising cost rises, ask what moved first. If CPM rose, you’re dealing with auction pressure or shrinking inventory. If CPC rose with stable CPM, the creative isn’t pulling as hard. If CPA rose with stable CPC, the funnel or measurement layer likely degraded.
This cause map prevents panic. It narrows the fix to the layer that changed, instead of throwing random “optimizations” at the problem.
It also helps you communicate clearly: you can tell stakeholders whether the issue is market-driven (auction) or controllable (creative, funnel, signals).
3) Run controlled tests that isolate one variable
Creative tests isolate messaging and format. Audience tests isolate targeting. Funnel tests isolate conversion friction. Measurement tests isolate signal quality changes (like adding server events or improving match keys).
Controlled tests are slower than random changes, but they’re cheaper in the long run because they produce learning you can reuse. That learning is what keeps social media advertising cost from creeping upward every quarter.
If you need speed, shorten test cycles—but don’t abandon isolation. Fast learning is only valuable when you can trust what caused it.
4) Scale with guardrails, not optimism
Scaling is where many teams accidentally overpay. They see a good day, double budgets, and then wonder why costs spike. The better approach is incremental scaling with clear stop-loss rules, especially for campaigns still stabilizing.
Guardrails can be budget pacing, bid caps, or automated rules—but the discipline is the same: scale what stays profitable across multiple cycles, not what looks good for 24 hours.
When you scale this way, you keep optionality. You can push spend without trapping yourself in a cost structure you can’t afford.
5) Close the loop with quality feedback
If you run lead gen, send “qualified” signals back. If you run ecommerce, feed the platform clean purchase events and values. If you run subscriptions, connect trials to renewals and churn signals in your own reporting.
LinkedIn has been especially direct about the value of deeper-funnel optimization. Their public materials describe performance patterns like improvements in attributed conversions and reductions in cost per action, and reporting on the same set of results has also appeared in industry media like AdExchanger’s coverage of conversion APIs.
That feedback loop is what turns optimization from “traffic buying” into a system that learns toward profit.
Implementation Stories
Frameworks feel abstract until you see them under pressure. The stories below show what implementation looks like when a team has to fix rising social media advertising cost in the real world—without pretending every week is a perfectly controlled experiment.
These are not fairy tales where one button fixes everything. They’re messy, operational, and human, which is exactly why they’re useful.
Each story focuses on a different “break point”: signal quality, lead quality, and the cost of making decisions without trustworthy attribution.
MarketerHire: When lead volume is fine, but lead quality breaks the economics
The panic didn’t start with spend. It started when sales conversations got weird. The calendar filled up, but the calls felt colder, and the team could sense that “more leads” was quietly turning into “more distraction.”
Then the blame game showed up. Marketing pointed at campaign dashboards. Sales pointed at pipeline quality. Meanwhile, social media advertising cost kept creeping upward because the system was optimizing toward the wrong success definition.
The backstory is that MarketerHire is a talent marketplace, and quality matters. The business doesn’t win when someone fills a form; it wins when the right buyer books, shows up, and turns into a qualified opportunity. That gap between “conversion” and “value” is exactly where paid social often gets expensive.
The wall was measurement. If the platform only sees surface conversions, it will happily buy cheap surface conversions—until the auction learns that cheap volume isn’t the same as business results. MarketerHire needed a way to teach the system what a qualified lead actually looked like.
The epiphany was to stop treating CRM data as a separate universe. They connected deeper-funnel outcomes back to LinkedIn through Conversions API using Zapier, so optimization could target quality rather than raw volume, described in LinkedIn’s MarketerHire customer story.
The journey was operational, not magical. They implemented the integration, tightened the definition of qualified outcomes, and used the new signal to align campaigns with what sales actually wanted. Over time, the marketing team gained a cleaner view of which LinkedIn-driven actions were turning into qualified buyers, reinforcing the signal loop discussed in LinkedIn’s performance gains write-up.
Then the final conflict hit: automation makes problems louder. When the system starts optimizing toward quality, it exposes bottlenecks—like follow-up speed, scheduling friction, and inconsistent CRM stage definitions. That’s where many teams give up and revert to cheaper surface conversions because they feel “safer.”
MarketerHire kept going, and the economics improved. They reported a 30% decrease in cost per qualified lead and a 35% improvement in conversion rate from appointment to qualified buyer in the customer story, with the same results echoed in Zapier’s write-up on automating LinkedIn conversions and referenced again in LinkedIn’s performance gains recap.
The dream outcome wasn’t just lower costs. It was peace: marketing and sales finally spoke the same language, and social media advertising cost started reflecting real business value instead of vanity volume.
SportSpar: When privacy shifts make performance feel random
It’s a specific kind of anxiety: you launch campaigns you’ve run before, and the results come back…different. Not just worse—unpredictable. The same budget produces inconsistent conversion reporting, and the team can’t tell whether performance changed or visibility changed.
That uncertainty is expensive. When you can’t trust signals, you hesitate to scale winners and you keep spending on losers because “maybe the tracking is broken.” Social media advertising cost rises because decision-making slows down.
SportSpar’s backstory was a common one for ecommerce teams operating in a privacy-first world: rising data protection measures, more fragile browser tracking, and a growing need to stabilize measurement so optimization could keep learning. Meta’s partner case study frames this challenge directly in the SportSpar story.
The wall was signal loss. When fewer events make it back to the platform, the algorithm learns slower and bids less efficiently. At the same time, reporting becomes harder to defend internally because performance debates turn into tracking debates.
The epiphany was to treat measurement as infrastructure. SportSpar worked with an agency partner to implement a more resilient setup using server-side GTM and Meta’s Conversions API, described from the Meta partner angle in Meta’s case study and from the implementation angle in Stape’s breakdown.
The journey wasn’t just “turn on CAPI.” It involved making sure events were deduplicated, match quality improved, and key conversion events stayed consistent across site changes. The agency’s own summary of the work and related outcomes is also referenced in ZweiDigital’s partner page, which emphasizes repeatable implementation patterns across clients.
The final conflict was expectation management. When teams improve measurement, reporting often changes immediately—and not always in the direction people expect. That can cause internal skepticism right when you need buy-in to keep refining the stack.
The dream outcome is regaining confidence: when measurement stabilizes, optimization becomes less emotional and more mechanical. And that’s when social media advertising cost stops behaving like a mystery tax and starts behaving like a controllable input.
Run implementation in sprints, not one-off projects
Break work into short sprints: measurement sprint, creative sprint, funnel sprint, and optimization sprint. Each sprint should have a single measurable outcome—like improved event integrity, faster creative refresh, or cleaner qualified lead feedback.
This prevents “forever implementations” that never ship. It also helps you isolate impact: you’ll know whether a cost reduction came from better creative, better tracking, or a better offer.
It’s the simplest way to avoid wasted effort while steadily improving social media advertising cost over time.
Enforce change control on events and conversions
Treat conversion definitions like a contract. If a form changes, the event owner updates mappings. If a checkout changes, the event owner validates purchase events end-to-end. If attribution settings change, document it immediately so reporting comparisons remain fair.
GA4 continues to evolve its attribution controls, including more granular attribution settings per conversion, highlighted in What’s new in Google Analytics. Those kinds of platform changes are exactly why disciplined change control matters.
Without it, teams often blame “higher social media advertising cost” on the market when the real culprit is a silent measurement break.
Prioritize quality signals before pushing scale
Scaling spend with weak signals is like pressing the gas while the dashboard is glitching. You might move faster, but you won’t know whether you’re heading toward profit or a wall.
When platforms talk about Conversions API outcomes, the consistent theme is better attribution and deeper-funnel optimization. LinkedIn has publicly shared results associated with Conversions API usage, including average changes in attributed conversions and cost per action, and expanded on the same set of findings in its Conversions API playbook. The reporting has also been corroborated in industry coverage like AdExchanger’s analysis.
Use that as a strategic north star: improve signal quality so the algorithm can learn toward what matters, then scale with confidence.
Use incrementality methods when the stakes rise
When budgets get big, attribution arguments get louder. That’s when you add incrementality testing or model-based counterfactuals to validate whether performance gains are real or just reallocated credit.
The industry is moving toward stronger incremental measurement frameworks, including formal guidance like IAB’s incrementality guidelines for commerce media.
You don’t need to run perfect experiments every week. But having an incrementality plan protects you from paying higher social media advertising cost for growth that isn’t actually incremental.
Document decisions so cost control becomes repeatable
Every time costs shift, write down the diagnosis and the lever you pulled. Over a few months, you’ll build a playbook that’s specific to your audience, your offer, and your market.
This is how professionals get faster: not by guessing better, but by learning systematically. It also makes client communication easier, because you can explain what changed, why you changed it, and what you expect next.
Over time, this is what turns social media advertising cost from a stressful variable into a predictable system you can manage.
Statistics and Data
If you’ve ever felt like your social media advertising cost “moved overnight,” you’re not imagining it. Costs are the output of an auction that reacts to demand, creative response, measurement quality, and what the platform believes it can predict. Data is how you separate a real performance shift from a reporting mirage.
The trick is choosing data that stays trustworthy when everything else changes. That means you’re not collecting “more dashboards.” You’re collecting a handful of signals that tell you what’s happening in the auction, what’s happening in the creative, and what’s happening in the customer journey.
The most useful analytics setups share one trait: they connect platform metrics to business outcomes fast enough that you can act before the auction punishes you.
Data set 1: Auction pressure
This is where you look for price changes that have nothing to do with your brand. If a major platform reports that its average ad prices rose, it’s a strong clue that your social media advertising cost might be getting pushed up by demand even if your creative and funnel stayed steady.
Meta’s 2025 results are a clear example of how platform-level pricing can move: the company reported that its average price per ad increased year over year in Q4 and across the full year, and independent industry coverage echoed the same pricing lift in WARC’s breakdown of Meta’s ad price trends and Nasdaq’s summary of the earnings release.
When that happens, your job isn’t to panic-tweak bids. Your job is to protect efficiency by improving response (creative and offer) and improving predictability (measurement and signals).
Data set 2: Signal recovery and measurement resilience
Signal loss quietly raises social media advertising cost because platforms learn slower and optimize with less confidence. This is why measurement improvements often show up as cost stability, not just prettier reports.
Google has been explicit about this in the rollout of Google tag gateway for advertisers: multiple Google properties describe an uplift in measurement signals when tags are served through your own domain, reinforced in Google Marketing Live 2025 announcements and Google’s own thought leadership on improving reliability with observable signals via tag gateway.
The practical takeaway is simple: if you can’t trust your conversion counts, you can’t trust your cost. Fix measurement first so every optimization decision is built on something solid.
Data set 3: Attribution changes vs lead or purchase quality
Sometimes costs don’t truly change; attribution changes. When tracking improves, “more conversions” can appear without any real change in customer behavior, which can make social media advertising cost look better or worse depending on how reporting is configured.
That’s why deeper-funnel signals matter. LinkedIn’s Conversions API results are widely referenced across LinkedIn’s own communications and independent reporting, including an average increase in attributed conversions and an average decrease in cost per action, with the same outcomes discussed in industry coverage like AdExchanger’s reporting on conversion APIs becoming table stakes.
The more your reporting is tied to qualified outcomes, the less your social media advertising cost gets distorted by “cheap” conversions that don’t become revenue.
Performance Benchmarks
Benchmarks are useful when they keep you from lying to yourself. They’re dangerous when you treat them like universal truth. The goal isn’t to match someone else’s CPM or CPA—it’s to understand whether your metrics are moving because of market pressure, creative response, or measurement changes.
Use benchmarks as guardrails: if you’re far outside a normal range, you’ve learned something. If you’re slightly above or below, it usually means nothing without context.
Here are the benchmarks that tend to be most actionable for managing social media advertising cost, because they connect directly to controllable levers.
Benchmark 1: Platform pricing direction
If a major platform reports that ad prices are rising year over year, it’s a strong warning signal that your baseline costs may drift upward even if your targeting and bids stay the same. Meta’s reporting on its average price per ad increases, reflected in WARC’s industry analysis and Nasdaq’s coverage, is the kind of benchmark that helps you set expectations with stakeholders.
When platform pricing is up, you’re not “doing something wrong” by default. But you do need a plan to offset auction pressure with stronger creative response and better conversion rates.
Benchmark 2: Signal uplift from measurement improvements
Signal uplift benchmarks matter because they hint at how much of your current social media advertising cost may be inflated by missing data. Google’s claim of an uplift in measurement signals via tag gateway is repeated across Google Marketing Live materials and Google’s broader guidance on improving reliability with observable signals.
Even if your exact uplift differs, the benchmark is still valuable: if your signal recovery is near zero after a measurement project, something is probably misconfigured—or your traffic mix isn’t being captured the way you think.
Benchmark 3: Attribution lift paired with efficiency gains
Benchmarks that combine “more attributed conversions” with “lower cost per action” are powerful because they suggest you didn’t just change reporting—you improved optimization inputs. LinkedIn’s Conversions API results are described in its measurement post, expanded in the playbook for marketers, and discussed in independent coverage like AdExchanger’s reporting.
If you only see attribution lift without efficiency gains, treat it as a reporting change until proven otherwise by downstream business metrics.
Analytics Interpretation
Analytics interpretation is where most teams burn money. Not because they lack data, but because they interpret it in the wrong order. When social media advertising cost moves, you want a diagnosis that points to a single layer you can fix.
The most reliable interpretation flow moves from “auction” to “response” to “journey,” because that mirrors how costs are created.
Use the sequence below to keep your decisions clean.
Step 1: Decide if it’s market pressure or your own performance
Start with platform-level pricing signals and category-level trends. If the platform is reporting higher average ad prices, don’t waste a week blaming your creative for a cost increase that’s happening across the market.
Meta’s reporting on rising average price per ad, mirrored in WARC’s analysis, is a good example of a macro signal that changes what “normal” looks like.
If macro pressure is up, your job is to improve efficiency so you can keep buying the same outcomes without overreacting.
Step 2: Separate “reporting improved” from “performance improved”
If you changed tracking, attribution settings, or event quality, you may be looking at a reporting shift. This can make social media advertising cost look like it improved even if user behavior didn’t change.
Google’s discussion of improving resilience with tag gateway signal uplift is a reminder that better measurement can change what you can observe, not just what you can influence.
Validate changes with downstream metrics (qualified lead rate, revenue per purchase, retention) before you declare victory.
Step 3: Look for the first metric that moved
If CPM rises first, think auction pressure and audience saturation. If CTR falls first, think creative fatigue or misaligned message. If conversion rate falls first, think landing page friction, offer mismatch, or broken tracking.
This “first move” approach keeps you from making random changes. It also makes it easier to explain the story to stakeholders without resorting to vague “the algorithm changed” language.
When interpretation is disciplined, optimization becomes calmer—and social media advertising cost becomes more controllable.
Case Stories
Stories make analytics real because they show what happens when a team is forced to make decisions under pressure. These examples focus on the moment social media advertising cost started to feel unstable—and what changed when the team treated measurement and interpretation like a system, not a dashboard.
Every story below is anchored in public reporting and primary brand-owned documentation. No made-up heroes, no imaginary percentages.
If you see yourself in the “wall” section, that’s the point. It’s usually the same wall every team hits—just with different platforms and different stakes.
Eventbrite: When cheaper clicks weren’t the goal, intent was
The numbers started sliding in a way that made everyone uneasy. Spend was moving, results were moving, but the team couldn’t shake the feeling that they were buying attention rather than real intent. Social media advertising cost didn’t look catastrophic on paper, yet confidence was draining by the day.
Then the internal questions got sharper. “Are we reaching people who actually want to do something?” “Are we just paying to show up in feeds?” The worst part was that the team couldn’t answer those questions fast enough to stop the doubt from spreading.
The backstory is that Eventbrite isn’t selling an impulse product—it’s selling plans. People need the idea first, then the decision, then the purchase. That makes intent signals incredibly valuable, and it makes generic “awareness reach” feel like a slow leak when budgets are under scrutiny.
At the same time, user behavior was shifting. TikTok wasn’t just a feed anymore; it was becoming a discovery engine. TikTok itself highlighted that many users start searching quickly after opening the app, which changed how the team thought about where intent could show up.
Eventbrite didn’t need more impressions. They needed moments where people were already looking.
The wall was that traditional optimization patterns weren’t giving the team a clean lever. They could tweak creative all day, but the underlying question remained: “Are we meeting demand, or trying to manufacture it?” Without a stronger intent layer, it was too easy to win cheap engagement and still lose the real business outcome.
Even worse, the team risked confusing “better CTR” with “better customers.” They needed proof that a different approach could improve performance without just shifting the attribution story.
That’s the kind of uncertainty that quietly raises social media advertising cost because it slows decision-making.
The epiphany came from reframing the channel. Instead of treating TikTok like a pure interruption feed, they leaned into search behavior and tested TikTok Search Ads. The move wasn’t “let’s try a new format.” It was “let’s buy intent while it’s visible.”
Public TikTok materials describe how Eventbrite paired keyword intent with relevant inventory and measured outcomes on complete payment transactions in TikTok’s Search Ads Campaign launch post and the Eventbrite case story.
And importantly, this wasn’t framed as a gimmick. It was framed as aligning distribution with how people were already behaving.
The journey was methodical. They structured search campaigns around intent-heavy categories, connected ads to relevant city-specific experiences, and used the output to inform future keyword strategy, as described in TikTok’s Eventbrite success story.
Then they watched the early indicators: click behavior, purchase completion, and whether the ads were pulling in the audience they cared about. A third-party write-up captured the headline momentum of the test—particularly the CTR lift—through quotes and context in Marketing Dive’s coverage of the campaign.
That mix of brand-owned documentation and outside reporting matters because it reduces the “platform-only narrative” risk.
The final conflict came from success. When results improve, the pressure shifts from “prove it works” to “scale it without breaking it.” Scaling introduces new problems: creative fatigue arrives faster, keyword inventory changes, and the team has to defend whether the gains are incremental or simply reallocated from other tactics.
It’s also when measurement debates return: if attribution settings differ by format, stakeholders can misread the performance story. The team needed to keep the measurement lens consistent while scaling.
Without that discipline, better results can still lead to worse decisions—and social media advertising cost can climb back up.
The dream outcome was a cleaner relationship between spend and intent. TikTok’s reporting stated that Eventbrite saw a +66% increase in click-through rates and a -33% decrease in CPA on complete payment transactions, reinforced in the case story recap.
But the deeper win was strategic: the team learned how to buy demand that already existed instead of paying to force attention. That shift is one of the most reliable ways to lower social media advertising cost without playing whack-a-mole with bids.
And it gave them a story they could defend—because it was rooted in intent, not just optimization folklore.
Square: When “better tracking” became a product decision, not a marketing task
The first sign of trouble wasn’t a graph; it was a meeting. Performance was being debated like a philosophy question, not a business question. People were talking past each other, and social media advertising cost felt impossible to pin down because nobody trusted the same numbers.
The tension got worse when changes shipped. A small website update could ripple through tags, and suddenly the team would spend days validating what should have been obvious. That kind of fragility turns every optimization into a risk.
The backstory is that Square operates with serious complexity—multiple products, multiple partners, and high expectations around privacy and security. Measurement isn’t just about attribution; it’s also about controlling data flows and keeping systems stable.
When your organization is built like that, “just add another pixel” is not a strategy. It’s a future incident report.
So the team needed a way to improve data collection without increasing chaos.
The wall was governance. Client-side tags are easy to deploy but hard to control at scale, especially when multiple tools compete for the same events. The marketing team needed better reliability, and the product/security reality demanded tighter control.
Those two needs often collide. Marketing wants speed; security wants certainty. If you choose one at the expense of the other, performance suffers.
Square needed a path that respected both.
The epiphany was to treat measurement like infrastructure and move collection into a more controlled environment. Google’s write-up captures Square’s rationale clearly, including the intent to improve collection while keeping data handling secure in the Square server-side tagging story.
That reframing matters. When measurement becomes infrastructure, it stops being “a marketing project” that gets deprioritized and starts being “a reliability project” that protects revenue.
It also changes how teams budget for it—because the upside isn’t just better reporting; it’s fewer costly mistakes.
The journey was operational. They aligned stakeholders, designed a server-side approach, and built a system that could send measurement data to partners in a way that fit their security posture, as described in Google Marketing Platform’s case study.
Instead of chasing new dashboards, they focused on making the same events more dependable. That’s the kind of change that stabilizes social media advertising cost because platforms learn from cleaner signals.
And it reduces the endless “is tracking broken?” debates that slow down optimization cycles.
The final conflict was ownership. Infrastructure requires maintenance. Events change, sites evolve, and teams reorganize. A measurement system is only as strong as the process that keeps it correct.
Without ownership, even a well-built setup decays quietly—until performance drops and everyone scrambles. The team had to operationalize responsibility so measurement didn’t become fragile again.
That’s the unglamorous part professionals get right.
The dream outcome is confidence you can feel. When measurement is stable, teams move faster because they’re not second-guessing every result. Social media advertising cost becomes easier to manage because the inputs to optimization are less noisy.
And when stakeholders ask what changed, you can answer in one sentence: we made performance decisions on data we can defend.
That’s what a professional analytics foundation buys you—before it buys you any “growth hack.”
Professional Promotion
When you do this work well, analytics becomes a career advantage, not just a campaign advantage. Clients and stakeholders don’t pay for dashboards—they pay for confidence. They pay for a system that keeps social media advertising cost predictable, explainable, and scalable.
The most effective way to “promote” your work professionally is to package it as outcomes and decision logic. Not vanity metrics, not platform screenshots, but a narrative that shows what changed, why it changed, and what the next decision is.
If you can communicate that clearly, you become the person people trust with bigger budgets.
Build a one-page cost story for every month
Keep it brutally simple: what happened to costs, what caused the change, what you did about it, and what you’re doing next. Anchor your explanations in defensible signals like platform-level pricing movements and measurement reliability improvements.
For example, if auction pressure rose, referencing macro pricing shifts like Meta’s reported changes in average price per ad (also reflected in industry analysis) helps stakeholders understand that you’re managing a market, not pushing buttons.
This is how you stop cost conversations from becoming personal and keep them professional.
Turn measurement upgrades into business language
Most teams describe measurement upgrades like a technical chore. Professionals describe them like a revenue safeguard: more reliable signals, fewer blind spots, more stable optimization, cleaner attribution debates.
Google’s framing of tag gateway highlights the business value of more resilient measurement signals in its product guidance, and the same value appears in Google Marketing Live summaries and Google’s broader perspective on improving reliability with observable signals.
Use that kind of language when you present your work: stakeholders don’t want “server-side tagging,” they want fewer expensive surprises.
Make “quality” the centerpiece of your cost narrative
If you work in lead gen or B2B, the fastest way to build trust is to tie cost to qualified outcomes. When you can explain cost per qualified lead (not just cost per lead), you separate yourself from commodity campaign managers.
That’s why Conversions API discussions resonate: they connect better attribution to better optimization. LinkedIn’s publicly shared results show up across its measurement communication, its CAPI playbook, and independent reporting like AdExchanger’s coverage.
When your professional identity becomes “the person who makes costs predictable by improving quality,” you don’t compete on price—you compete on outcomes.
Future Trends
The next two years will reward marketers who treat social media advertising cost like an engineering problem: better inputs, better feedback loops, better proof. The platforms are moving toward automation-first buying, regulators are tightening transparency, and measurement is being rebuilt around first-party signals and standardized event sharing.
That combination creates a weird reality: it’s getting easier to launch campaigns, and harder to know what’s truly incremental. The winners won’t be the teams with the most dashboards—they’ll be the teams that can keep costs stable while everything in the ecosystem keeps shifting.
Here are the trends that will matter most for anyone trying to keep paid social profitable and defensible.
1) Full-funnel automation becomes the default
Platform roadmaps are pushing toward “input your asset and budget, the system handles the rest.” Meta’s stated ambition to fully automate advertising with AI by the end of 2026 is the clearest signal of where this is going.
Automation can lower operational effort, but it raises the cost of weak fundamentals. If your conversion signals are noisy or your offer is unclear, automation doesn’t fix it—it scales it. The “future” skill isn’t learning every new button; it’s learning how to feed these systems clean signals and protect business outcomes.
That’s why your measurement spine becomes part of your competitive advantage, not just an analytics detail.
2) Event sharing is getting standardized
Conversion APIs are turning into table stakes, and the industry is starting to standardize how advertisers share events. The IAB Tech Lab’s introduction of an Event and Conversion API (ECAPI) is a strong sign that “every platform, different schema” is becoming unacceptable friction.
For social media advertising cost, this matters because consistency reduces breakage. When event definitions and payload expectations become clearer, fewer teams will lose optimization performance due to silent tracking drift.
It also makes cross-platform reporting less fragile, which reduces the chance you’ll overpay based on a single platform’s attribution narrative.
3) Ad transparency pressure will reshape targeting and reporting
In Europe especially, ad transparency expectations are hardening. The European Commission’s preliminary findings that TikTok’s ad repository falls short of Digital Services Act requirements have been widely reported, including coverage by AP News and The Guardian.
When transparency requirements increase, targeting and reporting practices tend to become more structured, more auditable, and sometimes more constrained. That doesn’t automatically raise costs—but it does raise the penalty for sloppy governance.
The teams that adapt fastest will treat compliance as part of performance, not a separate project.
4) Social search is becoming a performance channel
TikTok’s push into search ads is a signal that intent-driven behavior inside social platforms is no longer a side story. Search Engine Land’s reporting on TikTok doubling down on search ads reflects a broader shift: platforms want budgets that historically lived in traditional search.
For social media advertising cost, this creates a new lever: buying demand that already exists (intent) often behaves differently than trying to generate demand from scratch. Done well, it can stabilize costs by improving conversion rates and reducing wasted impressions.
Done poorly, it becomes expensive quickly, because you’re competing in a higher-intent auction where weak relevance gets punished.
5) Creator marketing is being treated like a standalone media line
Creator spend is no longer “experimental.” IAB reporting highlighted in TV Tech’s coverage of the IAB Creator Economy report points to creator investment growing rapidly and being tied to performance goals, not just awareness.
This matters because creators are often the bridge between scale and authenticity. When audiences trust the message, response improves—and response is one of the most reliable ways to keep social media advertising cost from drifting upward as you scale.
But the measurement challenge grows too, which is why incrementality and standardized event sharing will keep rising in importance.
Strategic Framework Recap

If you’ve read this far, you already know the uncomfortable truth: there is no single “average” social media advertising cost. There is only the cost your system produces—based on your offer, your creative response, your measurement quality, and how intelligently you scale.
Here’s the recap in plain language:
- Define value first. If you can’t explain what a conversion is worth, you can’t control what you can afford.
- Make signals durable. Cleaner event tracking and stronger first-party signal flow keep optimization stable when the ecosystem changes.
- Optimize by diagnosis, not by habit. Track what moved first (auction, response, journey) and adjust the layer that actually changed.
- Scale with proof. As spend grows, your risk of paying for non-incremental outcomes grows too—so add incrementality checks and allocation discipline.
- Build a creative system. Scaling without creative velocity is one of the fastest paths to rising costs.
The ecosystem is becoming more automated and more regulated at the same time. That’s why the “framework” isn’t optional—it’s how you keep control while everyone else chases platform trends.
FAQ – Built for the Complete Guide
What actually drives social media advertising cost up or down?
Costs are created by auction pressure (demand), ad response (creative and relevance), and conversion efficiency (funnel + measurement). When platforms report higher average ad prices, that’s a macro signal that your baseline may drift upward even if your setup doesn’t change, like Meta’s reported average price per ad increases.
My CPM went up, but my CPA didn’t. Should I worry?
Not automatically. CPM reflects the price of attention; CPA reflects the price of outcomes. If your creative response and conversion rate improved enough to offset higher CPM, your system is still healthy. Macro pricing changes can happen even when your account is performing well, as reflected in commentary like WARC’s analysis of Meta ad pricing.
What’s a “good” CPA for paid social?
A good CPA is any CPA that stays below your true value-per-conversion after costs, refunds, churn, and margin are accounted for. If you need an external anchor, use platform benchmarks for trend direction, not as a target, and validate with your own economics.
Why does social media advertising cost spike “overnight”?
Sudden spikes usually come from one of three causes: auction demand surges (seasonality or competitors), creative fatigue (response drops), or measurement breakage (signals drop, learning stalls). Regulation and transparency changes can also alter delivery and reporting behavior over time, illustrated by the EU’s scrutiny of TikTok ad transparency covered by AP News.
Are conversion APIs worth it if I already have a pixel?
They’re often worth it when signal loss is impacting optimization or attribution credibility. Industry messaging is moving toward standardized event sharing, highlighted by the IAB Tech Lab’s Event and Conversion API announcement, which reflects how central server-to-server event flows have become.
Do I need incrementality testing, or is attribution enough?
Attribution is useful for steering, but it can over-credit channels as you scale. Incrementality helps prove what was truly caused by spend. If you need a structured framework, the IAB and IAB Europe’s incrementality guidelines outline methods and when to use them.
Will AI automation make ads cheaper?
AI will make campaign execution easier, but “cheaper” depends on fundamentals. If your offer and signals are strong, automation can improve efficiency; if they’re weak, automation can scale waste. Meta’s ambition to push toward full automation is outlined in Reuters reporting, which is a reminder that your job becomes feeding the machine, not micromanaging it.
Is TikTok becoming a search ad platform, and does it affect costs?
It’s becoming a more serious search surface, and that can change how performance behaves because intent traffic often converts differently than feed discovery. The platform’s push has been covered in Search Engine Land, which suggests search ads are becoming a strategic pillar.
Should I invest in creators or traditional paid ads?
For many brands, it’s not either/or. Creators can improve ad response and trust, and trust affects auction efficiency. IAB reporting summarized in TV Tech indicates creator investment is increasingly tied to ROI and performance outcomes, not just awareness.
How fast should I make changes when costs rise?
Fast enough to protect budget, slow enough to learn. Diagnose what moved first, change one lever that matches the diagnosis, then evaluate against downstream business outcomes. When platforms are volatile, random changes can be more expensive than temporary inefficiency because they destroy learnings.
How do I scale spend without blowing up efficiency?
Scale in rungs, protect your best signals, and add causal checks as spend climbs. When you’re scaling into uncertainty, incrementality frameworks like the IAB’s commerce media guidelines help you choose the right proof method for the question you’re asking.
Work With Professionals
There’s a moment every marketer hits: you’ve learned the tactics, you’ve built a decent system, and you can manage social media advertising cost—yet your calendar still isn’t full of the right clients. You know you can drive results, but you’re stuck doing the hardest part alone: finding companies that actually want to hire you now.
That’s where a marketplace with the right structure changes your life. Not because it “magically” hands you success, but because it removes the friction that keeps good freelancers invisible. You want direct access, fast conversations, and a clean way to turn your skills into paid work without someone taking a cut of your earnings.
Markework is built around that idea: a marketing-focused marketplace where you can create a profile, browse listings, and message companies directly—without project fees or commissions. The platform positions itself as a focused marketplace for marketing roles and projects, with no project fees and subscription-based access, and a workflow designed for speed: create your profile, apply, connect, and close work faster, as described on the main platform page.
If you’re serious about landing more freelance work, the most valuable shift is momentum. When you can reach companies faster, negotiate directly, and keep your earnings intact, your career stops feeling like a hustle and starts feeling like a pipeline.
