
Media has stopped being a set of “places to run ads” and turned into an always-on system that shapes discovery, trust, and demand. Marketing has stopped being a campaign calendar and turned into the operating layer that connects brand, performance, product, and customer experience.
When those two realities collide, you get a simple truth: media and marketing either work as one integrated machine—or you pay for the gaps with wasted spend, inconsistent messaging, and reporting that feels “busy” but not convincing.
Article Outline
- What Is Media and Marketing
- Why Media and Marketing Matters
- Framework Overview
- Core Components
- Professional Implementation
What Is Media and Marketing

Media is the distribution layer: the channels, formats, and placements that put messages in front of people (paid, owned, earned, and shared). Marketing is the value-transfer layer: positioning, messaging, offers, creative, and experiences that turn attention into belief—and belief into action.
Put them together and “media and marketing” becomes the full system that moves a customer from first exposure to repeat purchase. It includes what you say, where you say it, how often you show up, what the experience feels like after the click, and how you prove to yourself that any of it worked.
This matters more now because media is no longer scarce. Attention is. A single buyer can bounce between creators, streaming platforms, search, retail marketplaces, podcasts, newsletters, and messaging apps in the same day—and your marketing only works if it stays coherent across that messy reality.
There’s a reason the money keeps pouring into this ecosystem: global advertising revenue hit new records, with WPP Media projecting $1.14 trillion in 2025, and the majority of that value concentrating in digital environments where targeting, measurement, and creative iteration can happen fast.
Why Media and Marketing Matters
Most teams don’t fail because they “picked the wrong channel.” They fail because the system is disconnected: the ad promise doesn’t match the landing page, the brand voice changes every time a new campaign launches, and reporting celebrates activity instead of outcomes.
In 2025, the strategic pressure is obvious: digital dominates the mix, with Reuters summarizing WPP Media’s estimate that digital accounts for roughly 73.2% of global ad revenue. When most spend flows into measurable, auction-based platforms, weak alignment gets punished immediately through higher costs, lower reach quality, and creative fatigue.
And the expectations for proof keep rising. In the U.S. alone, digital advertising revenue reached $258.6B in 2024 in the IAB/PwC Internet Advertising Revenue Report, which is another way of saying: the “default” competitive set is huge, sophisticated, and relentlessly optimized.
Practically, media and marketing matter because they’re the shortest path to three outcomes that finance teams actually respect:
- Efficient demand creation: you earn attention with the right message, then amplify it with the right distribution.
- Better conversion quality: the promise, proof, and experience line up, so fewer clicks get wasted.
- Clearer decision-making: measurement focuses on learning and tradeoffs, not dashboards that tell you everything and explain nothing.
It also matters because customers judge brands across touchpoints, not departments. People don’t separate “your ad” from “your onboarding email” from “your pricing page.” They experience one brand, one story, one level of trust.
Framework Overview
This framework treats media and marketing as a loop, not a line. You don’t “launch and move on.” You plan, execute, learn, and compound.
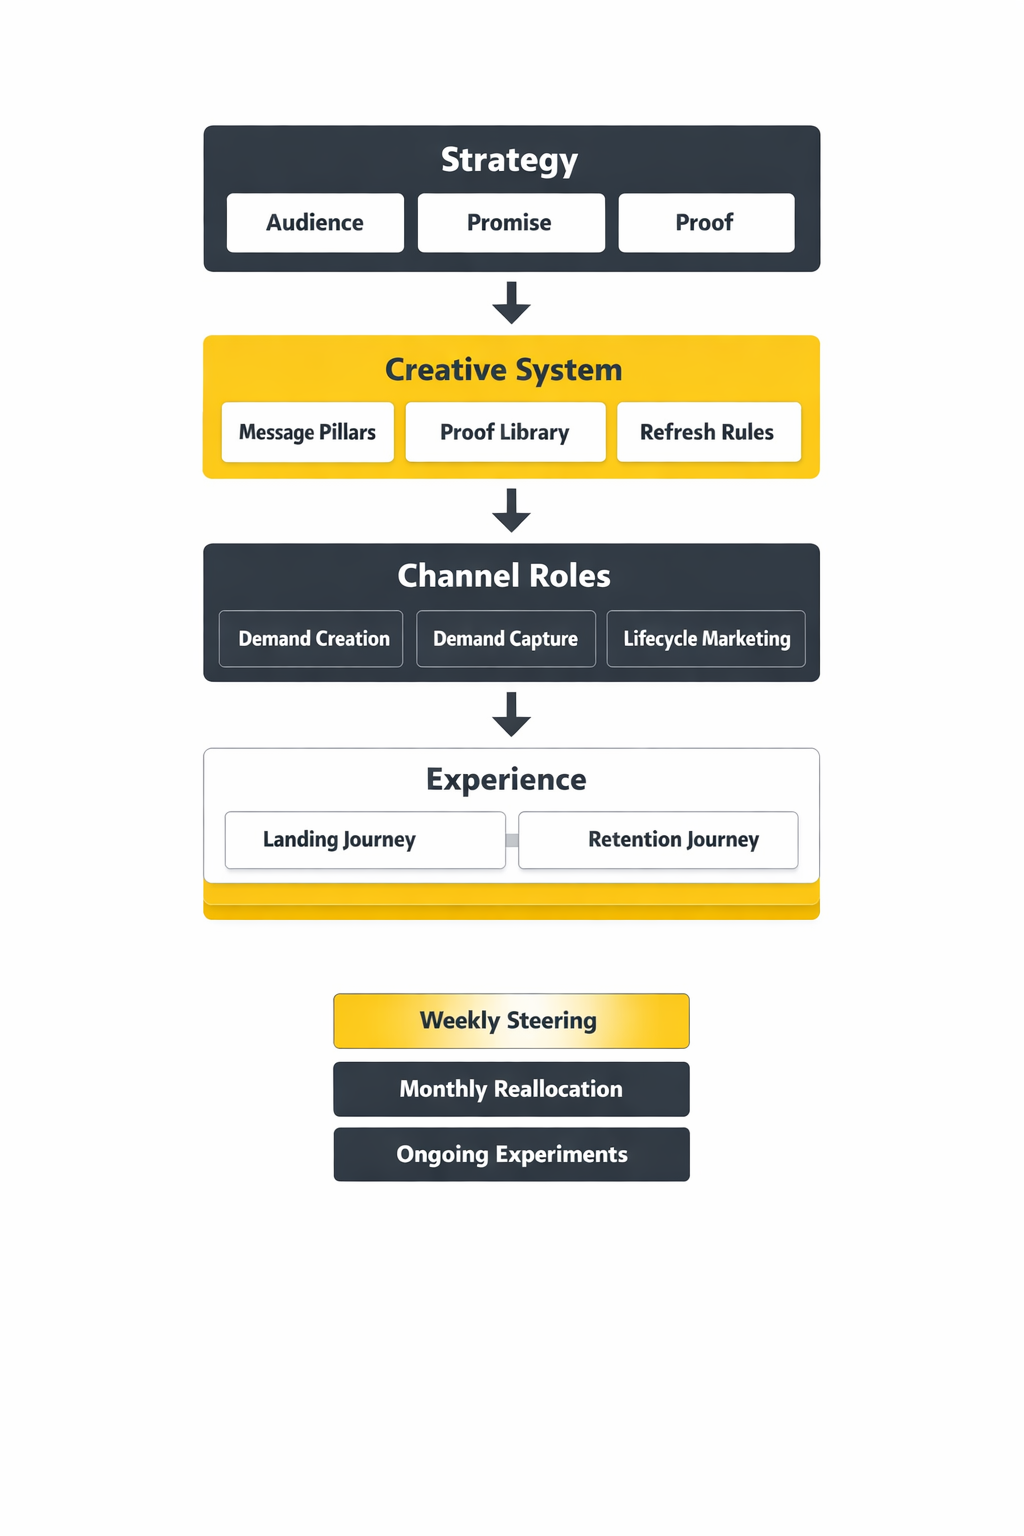
At a high level, the loop has five moves:
- Strategy: decide who you’re for, what you stand for, and what action you want next.
- Signal: translate strategy into messaging, offers, and creative that people actually notice.
- Distribution: place that signal across paid, owned, earned, and shared channels with a clear role for each.
- Experience: make the post-click (or post-view) journey match the promise—landing pages, product, sales, retention.
- Learning: measurement that helps you reallocate budget and improve creative, not just report what happened.
The goal is simple: make every channel reinforce the same positioning, and make every measurement cycle produce a decision you’d be willing to bet next month’s budget on.
Core Components
To keep the system from becoming “everything everywhere all at once,” anchor it on a few core components that stay stable even when channels change.
Positioning and Promise
This is the spine. If you can’t say, in plain language, why you’re the best choice for a specific kind of buyer, then media spend turns into a tax you pay to be ignored slightly less.
Creative That Carries the Strategy
Creative is not decoration. It’s the delivery mechanism for belief. The best teams treat creative as a portfolio: multiple angles, proofs, and formats built from the same strategic truth, rotated and refreshed to prevent fatigue.
Channel Roles
Channels should have jobs. Some channels are built to create demand (broad reach, video, creators, PR). Others harvest demand (search, retail media, high-intent partnerships). When every channel is forced to do everything, you get muddled messaging and confusing attribution.
Measurement You Can Act On
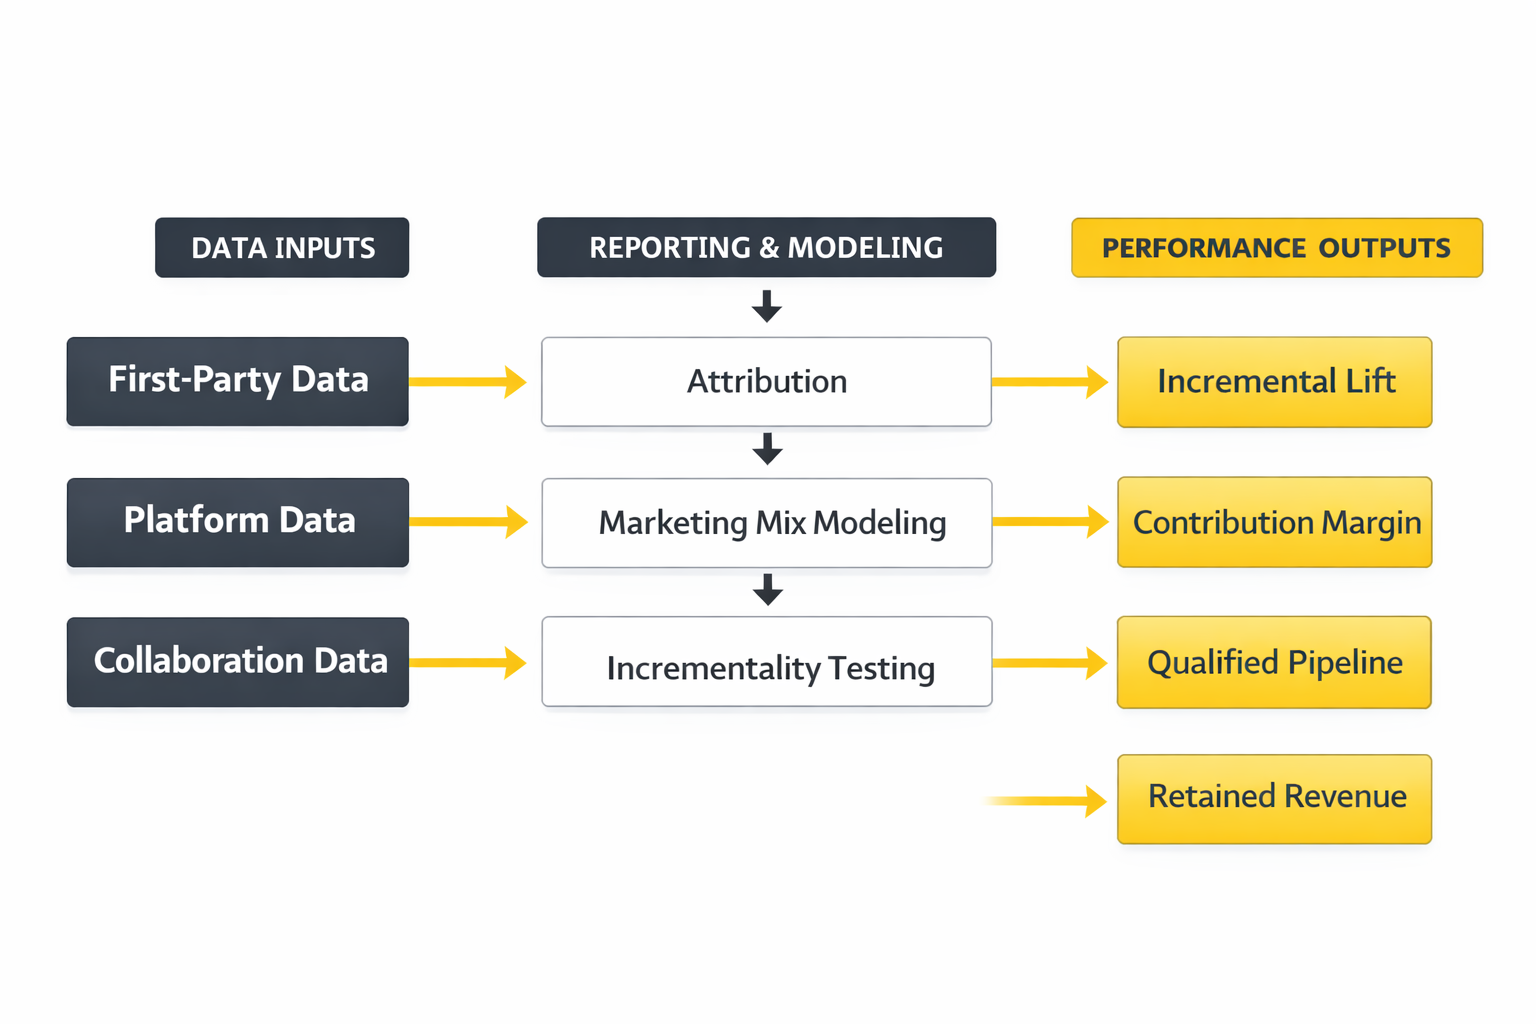
Modern measurement is less about finding a perfect single source of truth and more about building a trustworthy decision stack: platform signals for speed, first-party data for reality, and modeling/experimentation to understand incremental impact over time.
Operating Rhythm
The hidden advantage is cadence: how often you ship new creative, review learnings, refine audiences, and adjust offers. Most “marketing problems” are really rhythm problems—teams either move too slowly to learn, or too chaotically to compound.
Professional Implementation
Professional implementation is what makes this framework feel calm instead of overwhelming. The difference is not more tools—it’s a cleaner operating system.
In practice, that means:
- One strategy document that survives campaigns: audience, positioning, proof points, and non-negotiable brand voice rules.
- A creative pipeline: a repeatable way to generate, test, and refresh creatives without reinventing the wheel each month.
- A channel map with roles: demand creation, demand capture, and retention clearly separated, with budgets tied to each role.
- A measurement ladder: fast indicators for weekly steering, deeper analysis for monthly reallocation, and periodic tests for what’s truly incremental.
- A decision meeting that changes things: not a reporting meeting—one where budgets move and creative priorities shift.
When the system is set up this way, “media and marketing” stops being a pile of tactics and becomes a growth discipline: you build trust, you buy reach intelligently, and you learn faster than competitors who are still arguing about which dashboard is right.
Tools Supporting the Framework
Once you treat media and marketing as an operating system (not a pile of campaigns), tools stop being “nice-to-have” subscriptions and start acting like load-bearing infrastructure. They’re how you keep the message consistent across channels, move data safely, and make decisions without guessing.
There’s also a hard reality behind the tooling conversation: teams keep buying platforms faster than they can absorb them. The average organization reported using only a minority of its overall martech capability, and the same utilization story shows up again in research that cites the Gartner Marketing Technology Survey’s reported 33% utilization figure and in industry analysis that discusses that exact decline as a strategic problem, not a tooling problem in the “Martech for 2024” report.
So the goal here isn’t to collect tools. It’s to build a stack that makes media and marketing easier to run: fewer gaps, fewer manual steps, clearer measurement, and a faster rhythm of creative learning.
Tool Categories
Most modern stacks become understandable the moment you sort tools by the job they do. If you’re building or cleaning up media and marketing, these categories map cleanly to the framework you’re already using.
Data Collection and Identity
This layer captures first-party signals and makes them usable across the stack. It’s where you decide what events matter, how you handle consent, and how you avoid sending messy, duplicated, or contradictory data downstream.
- Tag and event management: keeps instrumentation sane across web and apps.
- Server-side tracking: reduces reliance on brittle browser-only measurement, which is why many teams implement tools like Meta’s Conversions API alongside browser pixels.
- Identity resolution and matching: helps connect sessions, users, and customers responsibly using first-party data.
Warehouse and Governance
This is where marketing data becomes “real” enough to trust. A warehouse doesn’t magically fix measurement, but it gives you one place to reconcile spend, exposure, on-site behavior, and revenue—so teams stop arguing about whose dashboard is right.
- Cloud data warehouses: centralize data for analysis and activation.
- Data quality and governance: naming standards, validation, access control, and documentation.
- Clean rooms: privacy-preserving collaboration when you need to analyze overlap or effectiveness with partners without moving raw user-level data around.
Measurement and Analytics
This layer answers the question everyone actually cares about: did media and marketing create incremental value, or did it just create activity?
- Product and web analytics: understand journeys, drop-offs, and behavior patterns.
- Attribution and experiment tooling: helps you validate what truly moved the needle.
- Privacy-safe reporting environments: platforms like Ads Data Hub exist because measurement increasingly happens inside controlled environments with strict aggregation rules for user privacy as described in Ads Data Hub privacy checks.
Activation and Orchestration
This is where insight turns into action. It’s also where stacks get bloated fast, because it’s tempting to buy a new activation tool every time you add a new channel.
- CRM and sales systems: the source of truth for pipeline and customer status.
- Email, SMS, and lifecycle automation: turns customer signals into retention and repeat purchase.
- CDP-style activation: helps sync audiences and events into ad platforms, personalization tools, and messaging systems.
Creative and Collaboration
Creative is where strategy becomes visible. This category is often undervalued because it looks like “workflow,” but it directly affects speed, consistency, and whether you can actually learn from creative tests.
- Creative production and versioning: keeping variations organized across placements.
- Approval and compliance workflows: essential for regulated industries and larger teams.
- Asset management: so the brand doesn’t fragment as volume increases.
Tool Comparison
Tool selection gets easier when you compare options the way a senior operator would: by failure modes. In media and marketing, tools rarely “fail” on features—they fail when the organization can’t maintain them, trust them, or connect them to outcomes.
Comparison Criteria That Actually Matter
- Time-to-value: will you see a meaningful improvement in weeks, or will implementation consume a quarter?
- Data portability: can you export clean, well-structured data, or does the tool trap value inside its UI?
- Integration depth: does it connect through robust APIs and native connectors, or through fragile one-off “zaps” that break silently?
- Governance and access controls: can you safely give the right people access without creating compliance risk?
- Measurement credibility: does the tool help you get closer to incremental impact, or just produce prettier reports?
- Operational fit: can your team realistically run it with the people you have?
Common Stack Patterns
Most teams land in one of these patterns. None is “best.” The right choice depends on your growth model, your data maturity, and how fast you need to move.
- Platform-centric: one primary suite plus a few add-ons. It’s simpler to manage, but can limit flexibility.
- Warehouse-centric: data warehouse as the center, with tools plugged in for activation, messaging, and reporting. It’s powerful, but demands stronger data discipline.
- Channel-centric: teams run separate stacks per channel. It can move fast early, but often collapses under duplicated data and inconsistent reporting.
Privacy-First Reality Check
Privacy isn’t a trend anymore—it’s architecture. If you’re evaluating tools for media and marketing, make sure you understand how they behave when user-level data can’t be freely stitched together.
- Server-side event pipelines: options like Conversions API exist specifically to send events directly from your server to ad platforms.
- Clean room environments: purpose-built collaborations where data stays controlled and outputs are aggregated, which is the guiding model behind environments like Ads Data Hub privacy checks.
- Governance as a feature: access rules, auditing, and aggregation thresholds are not paperwork—they’re how you keep measurement possible without creating risk.
Real Tool Stack Stories
These are real examples that show what stack decisions look like when the pressure is on. No “perfectly linear” success stories—just what tends to happen when media and marketing outgrow the tools holding them together.
NIQ Builds a Global Clean Room When Measurement Gets Political
It started with a problem that felt bigger than marketing: retailers and brands were pushing budgets harder, leadership wanted proof faster, and everyone involved was anxious about privacy. Meetings that used to be about planning became debates about data access, who could share what, and whether any analysis would survive legal review. The room wasn’t hostile, but it was tense in that specific way only “measurement accountability” can create.
The backstory was predictable and still painful. Retail media and shopper data had become incredibly valuable, but collaboration was harder than ever because customers expect privacy and regulators expect restraint. Brands wanted clearer ad effectiveness measurement; retailers wanted to protect their data advantage; both needed a model that didn’t require copying raw data into yet another place. The old workflow of spreadsheets, exports, and vendor dashboards wasn’t just slow—it was becoming risky.
Then they hit the wall. Every “quick fix” created a new problem: sharing too much created compliance exposure, sharing too little made results unusable, and moving data around increased security and audit complexity. Teams could agree on the question, but not on the method. Even when people were acting in good faith, the process kept breaking on privacy and governance constraints.
The epiphany was realizing the solution wasn’t a new dashboard—it was a safer collaboration environment. Instead of trying to make everyone comfortable with data movement, they moved the work to where controls could be enforced. That’s the logic behind NIQ’s decision to launch a global data clean room on Snowflake, positioned around enrichment and ad effectiveness measurement in NIQ’s announcement.
The journey was less glamorous than the headline. It meant aligning stakeholders on what outputs were allowed, what match keys could be used, and how results would be reviewed and distributed. It meant building workflows that made privacy the default, not an afterthought. It also meant educating teams that clean rooms are not magic—they still require clear hypotheses and clean first-party data to be useful.
The final conflict was operational: once the environment exists, demand for answers explodes. More partners want access, more teams want custom cuts, and governance can become a bottleneck if you don’t design for scale. That’s why clean-room tools emphasize approved aggregation and privacy rules as first-class constraints, not optional settings as shown in Ads Data Hub’s privacy model.
The dream outcome is not “perfect attribution.” It’s faster, safer collaboration where brands and retailers can answer real questions without turning every analysis request into a legal negotiation. And when that works, media and marketing stop fighting the data reality and start using it.
Papaya Global Hits Growth Friction and Uses HubSpot to Stabilize the Machine
The crisis wasn’t dramatic in public, but it felt dramatic inside the team: growth was accelerating, requests were flying in from every direction, and the marketing operations function was stuck putting out fires. Every small change—routing leads, syncing fields, fixing reporting—created a new edge case. The feeling was constant: the system could break at any moment, and the team would be blamed for “leads” when the real problem was plumbing.
The backstory was a common one. In fast growth, teams adopt tools quickly: forms here, email there, spreadsheets everywhere, and a CRM that slowly becomes the battleground for definitions. As channels expand, media and marketing generate more signals, and each signal has to land somewhere reliably. Without stable integration and clear workflows, scale turns into chaos.
The wall came when “more work” stopped solving it. Adding more dashboards didn’t fix broken handoffs. Adding more tools didn’t fix inconsistent data. Even hiring didn’t fully help, because new people were learning an unstable system. The team needed an operating layer that could absorb complexity, not amplify it.
The epiphany was recognizing that the most valuable tool wasn’t the flashiest—it was the one that let operations solve problems daily without rebuilding the stack every week. In HubSpot’s own customer story, Papaya Global’s marketing operations manager describes using HubSpot to find creative solutions to operational challenges and to optimize performance at a granular level in the Papaya Global story.
The journey was about consolidation and discipline. Standardizing lifecycle steps, tightening data hygiene, and making sure reporting matched the way the business actually sells. Integrations became intentional instead of accidental. And once the system was stable, the team could finally focus on improving messaging, offers, and channel execution instead of constantly repairing tracking and routing.
The final conflict was adoption. A cleaner stack forces behavior changes: sales has to respect lifecycle stages, marketing has to stop “quick hacks,” and everyone has to agree on definitions. That’s where many implementations fail—not because the tool lacks features, but because the organization doesn’t enforce operating standards.
The dream outcome is boring in the best way. Fewer surprises, fewer emergency fixes, and a stack that lets media and marketing compound. When the foundation holds, you can move faster without feeling reckless.
Implementation Principles
- One owner per system: every major tool needs an accountable operator, even if multiple teams use it.
- Documented naming and taxonomy: campaigns, events, audiences, and conversions must follow rules so reporting stays coherent over time.
- Data contracts for events: when an event changes, downstream systems shouldn’t silently break.
- Least-privilege access: fewer people with admin rights, clear approval workflows, and auditable permissions.
- Measurement designed for privacy constraints: if you rely on environments that enforce aggregation and privacy thresholds, plan reporting outputs accordingly using the same logic Ads Data Hub requires.
A Sequence That Prevents Tool Sprawl
If you’re implementing tools to support media and marketing, sequence matters. This order prevents the most common failure: building activation before you can trust the data.
- Step 1: Instrumentation and consent: define the events that matter and ensure consent handling is consistent.
- Step 2: Data unification: warehouse or central store, plus basic data validation.
- Step 3: Measurement layer: reporting that ties spend to outcomes with a clear logic you can explain.
- Step 4: Activation: audience sync, lifecycle automation, and personalization once the inputs are dependable.
- Step 5: Creative operations: scale testing only after you can measure and learn reliably.
What to Audit Every Quarter
Tool stacks drift. A quarterly audit keeps media and marketing from slowly decaying into “expensive chaos.”
- Tool utilization: retire or consolidate anything that isn’t used in a way that maps to outcomes, especially in light of the persistent utilization gap highlighted across Gartner-linked research in this Gartner-referencing market guide.
- Event health: duplicates, missing parameters, broken funnels, and inconsistent attribution signals.
- Audience logic: are audiences stable, explainable, and aligned to strategy—or are they random collections of clicks?
- Reporting integrity: do dashboards answer decisions, or do they just accumulate metrics?
- Privacy and governance: access reviews, data retention, and compliance checks for any collaboration environments.
When the stack is implemented with discipline, tools become a quiet advantage. They make media and marketing feel less like juggling and more like steering—because you can finally trust the signals, move budget with confidence, and scale creative without losing coherence.
Step By Step Implementation
Implementing media and marketing well is less about doing “more” and more about sequencing the work so every layer supports the next. When teams skip steps, they usually pay for it later with messy tracking, inconsistent creative, and optimization that’s basically guesswork.
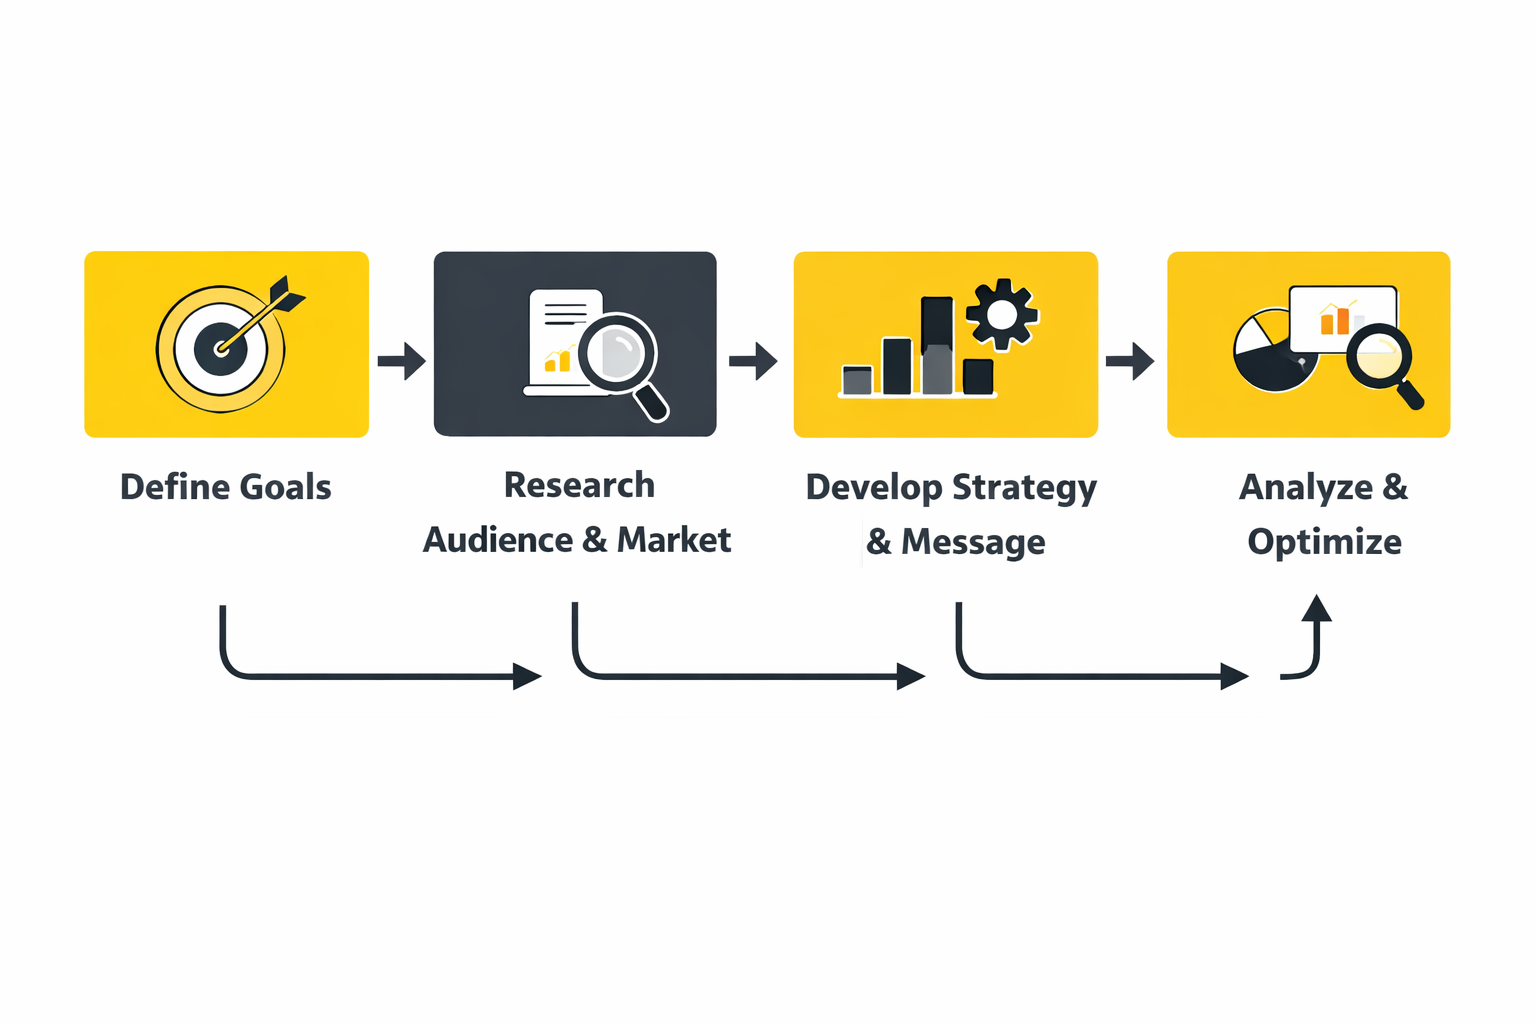
Step 1: Lock Strategy Before You Touch Platforms
Start with the one-page truth: who you’re targeting, what they want, what you’re promising, and what proof you have. Keep it plain enough that a designer, a performance marketer, and a founder would all describe it the same way.
- Audience: define the specific buyer you’re trying to win, plus the “not for us” buyer you’re willing to lose.
- Positioning: explain why you’re different in language your customers actually use.
- Offer: be clear on what the customer gets and what you want them to do next.
- Proof: reviews, demos, benchmarks, guarantees, case studies, comparisons—whatever reduces risk in the customer’s mind.
Step 2: Map the Journey You Want People to Experience
Media and marketing fail when the click lands in the wrong story. Before you run anything, decide what people should see at each stage: first impression, consideration, decision, and repeat.
- First impression: what’s the simplest idea that makes a stranger care?
- Consideration: what proof answers “is this legit for me?”
- Decision: what removes friction and makes the next step feel safe?
- Repeat: what keeps the relationship alive after purchase?
Step 3: Build the Measurement Foundation You Can Actually Trust
Before you scale spend, decide which outcomes matter and how you’ll verify them. A lot of teams treat measurement like a reporting job; the better approach is to treat it like a decision system.
- Define one primary conversion: the action that most reliably predicts revenue (not the easiest event to track).
- Define supporting signals: steps that explain why performance is moving (e.g., qualified leads, demo completion, repeat purchase).
- Protect signal quality: server-side event approaches exist because browser-only measurement can lose data, which is why patterns like Meta’s Conversions API are widely implemented.
Step 4: Create a Creative System, Not Just “Ads”
Creative is where the strategy lives. Build a repeatable structure that makes it easy to generate strong variations without turning every launch into a chaotic brainstorm.
- Message pillars: 3–5 angles that are true, distinct, and provable.
- Formats: decide which placements you’ll win (short video, static, carousel, creator-style, landing-page-first).
- Proof library: testimonials, data points, demos, comparisons, FAQs, objection-handlers.
- Refresh rules: when a concept is working, you don’t “leave it alone,” you produce iterations that keep it fresh.
Step 5: Assign Channel Jobs and Budget Like an Operator
Channels shouldn’t compete to take credit for the same conversion. Give each channel a job, then judge it by whether it did that job well.
- Demand creation: reach and attention (often video, creators, PR, broad social).
- Demand capture: high intent and comparison (often search, marketplaces, retargeting with clear rules).
- Lifecycle: retention, upsell, and community (email, SMS, in-product, loyalty).
Step 6: Launch Small and Learn Fast
Don’t treat the first launch like a “big bet.” Treat it like a diagnostic. You’re trying to discover which messages, audiences, and experiences deserve scale.
- Start with creative breadth: more angles beats more budget early.
- Keep the landing experience tight: the ad promise and the page headline should feel like one sentence.
- Build a learning log: document what worked, what didn’t, and what you’ll test next.
Step 7: Scale With Guardrails
Scaling isn’t “turning up spend.” It’s expanding what’s already working while protecting signal quality and user experience.
- Increase budget gradually: keep performance stable while you scale supply.
- Expand placements intentionally: don’t force one creative style into every format.
- Invest in measurement depth: when spend rises, you need stronger methods to understand incrementality, not just platform attribution.
Execution Layers
It helps to think of media and marketing execution as stacked layers. Each layer has its own craft, but they only work when they connect cleanly. If you feel like you’re “doing everything” and still not seeing progress, it’s usually a layer problem.
Layer 1: Strategy and Briefing
This is where you decide what you’re trying to make true in the market. A strong brief makes execution faster because it reduces interpretation and protects the message from drifting as more people touch it.
Layer 2: Creative and Offer
This layer is the customer’s reality. Your offer and creative decide whether someone leans in or scrolls past. When teams blame “the algorithm,” the issue is often that the offer is too generic or the proof is too thin.
Layer 3: Distribution and Buying
This is where you match the message to the environment. The same idea lands differently in short-form video, search, and email. Professional media and marketing execution adapts to each channel while staying consistent in the core promise.
Layer 4: Landing and Conversion
If the post-click experience doesn’t deliver the same story, you’ll pay for it with wasted spend. Conversion work isn’t only design; it’s clarity, trust, and momentum. Your page should answer questions in the order people feel them.
Layer 5: Retention and Lifetime Value
Media and marketing get cheaper when customers stay. Retention doesn’t need to be complicated—it needs to be intentional: onboarding that reduces regret, messaging that reinforces value, and offers that keep the relationship alive.
Layer 6: Measurement and Learning
This layer tells you whether you’re building real growth or just generating platform-reported activity. When measurement improves, teams become calmer, because decisions feel earned instead of argued.
Optimization Process
The cleanest optimization process is one that separates “fast steering” from “slow truth.” Fast steering helps you avoid wasting money this week. Slow truth helps you avoid building a strategy on misleading signals.
Weekly Steering
Weekly optimization is about protecting efficiency and learning quickly. It’s where you fix obvious leaks and keep creative fresh enough that the system doesn’t decay.
- Creative triage: pause clear losers, iterate winners, and keep new concepts entering the pipeline.
- Funnel friction checks: if conversion drops, inspect the journey before blaming media (page speed, form issues, pricing clarity).
- Signal health: confirm that events are firing reliably, especially if you rely on server-to-platform connections like Conversions API.
Monthly Reallocation
Monthly optimization is where budgets and channel roles get adjusted. The key is to stop treating spend like an entitlement. Every channel keeps its budget by earning it.
- Role-based evaluation: judge awareness channels by reach quality and engagement lift, capture channels by high-intent efficiency, lifecycle by retention and repeat.
- Creative insights become strategy: if one message is consistently winning, it should influence your broader positioning and site copy.
- Landing page iteration: refresh proof points and objections as you learn what people hesitate on.
Quarterly Truth-Finding
Quarterly is where you pressure-test what you think you know. This is the zone for incrementality testing, lift studies, and marketing mix work—methods designed to answer “what would have happened without this spend?”
- Incrementality thinking: Google’s measurement guidance frames incrementality tests as a way to estimate the additional value created beyond what would have happened anyway, with examples of how a test can change budget decisions in this incrementality testing explainer.
- Lift studies: platforms and partners commonly use controlled experiments to isolate impact, like the multi-cell conversion lift approach described in Meta’s DSB success story.
- Marketing mix learning: when you need a broader view across channels, MMM approaches are used to understand contribution and synergy, like the examples shared in Google’s MMM growth engine article.
Implementation Stories
Implementation stories are where media and marketing stop feeling theoretical. These are real-world examples of teams trying to build a system that holds up under pressure—when leadership wants answers, channels change, and the old measurement stories stop being believable.
Nexon Builds a Measurement Spine So Budget Decisions Stop Being Political
The moment of high drama hit during a planning cycle that should have been routine. Budgets were on the table, every channel had a narrative, and nobody could agree on what was truly driving performance. The tension wasn’t about numbers on a slide—it was about trust, because each dashboard told a slightly different story and everyone had a favorite “truth.”
The backstory was years in the making. Like most modern brands, Nexon was operating in a multi-touch world where buyers didn’t move in straight lines. As channels multiplied, reporting multiplied too, and the organization got faster at launching activity than at explaining outcomes. Over time, the measurement conversation became less about learning and more about defending spend.
Then they hit the wall. Last-click style thinking couldn’t explain the interactions between touchpoints, and pure platform reporting couldn’t resolve overlap and halo effects. When every channel claims credit, it becomes hard to kill anything—and even harder to scale what actually works. The team needed a way to see the system, not just the parts.
The epiphany came from reframing the problem as “we need a model that helps us make decisions,” not “we need a prettier report.” That’s why they leaned into marketing mix modeling as a way to understand channel contribution and synergy in a more holistic way. Google’s write-up on how Nexon approached MMM puts the emphasis on using modeling to identify what drives the growth engine and how channels support one another in this MMM case-based article.
The journey wasn’t a single project—it was a new operating rhythm. They had to get the right data inputs, align on what the business actually cares about, and translate model outputs into decisions that operators could act on. They also had to build internal comfort with the idea that no model is perfect, but a consistent model is better than a new argument every month. Over time, the work shifted from defending channels to improving them.
The final conflict was that measurement clarity creates demand for even more clarity. Once leadership sees a method that feels more credible, they want to apply it everywhere, immediately. That can backfire if teams treat MMM like a shortcut instead of a disciplined practice that needs good inputs and sensible interpretation. It’s also where teams can overreact—making changes too fast, before learnings stabilize.
The dream outcome is a calmer growth machine. Budget discussions become less emotional, because the organization shares a common language for impact. Creative and channel teams get clearer direction, because “what to test next” becomes obvious. And media and marketing start compounding, because learning stops getting reset every time a new quarter starts.
Samsung UK Tightens Omnichannel Measurement When the Old Signals Start Failing
The pressure showed up when campaign performance looked “fine,” but confidence was dropping. Reports didn’t feel wrong, but they also didn’t feel solid—especially when online and offline behavior didn’t line up neatly. Teams were being asked to explain impact across touchpoints, and the answers were starting to sound like guesses wrapped in numbers. That’s a terrifying place to be when budgets are large and scrutiny is high.
The backstory was the reality of modern media and marketing: customers move between devices, stores, and channels without asking permission. That makes simple tracking brittle and attribution easy to overtrust. As privacy and platform constraints intensified, it became harder to treat browser tracking as the full story. Omnichannel brands felt that shift early because their outcomes happen in more than one place.
The wall came when “more optimization” didn’t create more certainty. Tweaking audiences and bids can improve platform metrics, but it doesn’t necessarily improve truth. The team needed stronger ways to connect marketing activity to outcomes. And they needed methods that could survive the reality of privacy constraints.
The epiphany was moving closer to first-party signal and controlled testing. That’s why Samsung UK’s Meta success story emphasizes a combination of lift studies and server-to-platform measurement via Conversions API as part of how they evaluated omnichannel impact in this Samsung UK case overview. The big idea wasn’t “a new tool,” it was “a more defensible approach.”
The journey involved aligning stakeholders on what would count as proof, then implementing measurement methods that matched that standard. It meant treating lift studies as learning tools, not as PR. It also meant making sure event signals were reliable enough to be useful when they arrived in-platform. That kind of implementation work is quiet, but it’s what makes optimization worth doing.
The final conflict was adoption and interpretation. Better measurement doesn’t eliminate debate; it changes the debate. Teams still need to agree on what actions to take when lift is strong in one area and weaker in another. And they need discipline to avoid “chasing the last result” instead of building a stable learning program.
The dream outcome is not perfect attribution—it’s decision confidence. When media and marketing leaders can explain what’s working with more credibility, they can invest with less fear. Teams can shift from reactive changes to intentional iteration. And the customer experience improves because the system is optimized around reality, not vanity metrics.
A Practical Implementation Checklist
- One source of strategy truth: a living doc that defines audience, positioning, proof points, and voice.
- A creative operating system: message pillars, proof library, production workflow, and a refresh calendar.
- A measurement contract: primary conversion, supporting signals, clear naming, and reliable event collection.
- Channel role clarity: each channel has a job and a success definition that matches that job.
- A learning cadence: weekly steering, monthly budget shifts, quarterly truth-finding via experiments or modeling.
What Professionals Do Differently
Teams that run media and marketing professionally tend to do a few things that look almost boring from the outside. They write things down. They keep definitions consistent. They treat measurement as a decision engine. And they invest in creative iteration the way product teams invest in shipping improvements.
Most importantly, they don’t let implementation drift. They revisit assumptions, update their proof points, and keep the system aligned to how customers actually behave—because that’s what turns marketing effort into marketing momentum.
Statistics and Data
Media and marketing get dramatically easier to manage when you anchor decisions to a handful of numbers you can defend. Not “every metric available,” but the few signals that reliably answer: are we creating demand, capturing it efficiently, and retaining customers at a healthy margin?
Zooming out first helps. U.S. internet advertising revenue reached $259B in 2024 with 15% year-over-year growth, and the same figure is echoed in independent coverage that cites $258.6B for 2024 from the IAB/PwC report and in industry reporting that repeats that $258.6B headline number. When that much money is flowing through measurable channels, “close enough” measurement becomes expensive.
At a global level, spending expectations also signal how competitive the landscape is. WPP Media’s forecast projects $1.14 trillion in global advertising revenue in 2025, and that projection is repeated in independent coverage like Marketing Brew’s summary of the same forecast and reporting that discusses the revised outlook while still placing 2025 ad revenue around the $1.08T–$1.14T range depending on scenario. The takeaway isn’t “spend is big.” It’s that buyers have choices, competitors are investing, and your edge comes from learning faster.
Performance Benchmarks
Benchmarks are useful when you treat them as context, not targets. They help you spot when something is broken (way below normal), when something is healthy (in range), and when you might be ready to push harder (in the top tier). In media and marketing, the best benchmarks are the ones tied to the part of the funnel a channel is supposed to serve.
Macro Benchmarks for the Ad Market
If you want a quick gut-check on competitiveness and pricing pressure, start with market-level signals.
- Digital growth tailwind: the U.S. market hitting $259B in digital ad revenue in 2024 is a reminder that “not advertising” is rarely the safe option when your category is scaling online.
- Rising auction pressure: Meta reported its average price per ad increased 10% year-over-year in 2024, and later reported a 9% year-over-year increase for full-year 2025. That’s not a reason to panic; it’s a reason to be serious about creative quality and conversion experience, because the market won’t stay cheap for you out of kindness.
Email and Lifecycle Benchmarks
Email is one of the most measurable parts of media and marketing, and it’s often the fastest way to recover margin because it amplifies value from traffic you already paid for.
- Volume and reliability: Klaviyo’s 2024 benchmarks are based on over 325B emails, which makes them a useful reference point for ecommerce and DTC teams.
- Click behavior reality check: Klaviyo’s updated benchmark summary highlights an average email campaign click rate of 1.69% across industries, which is helpful when teams assume “email clicks should be huge” and overreact to normal variance.
Search and Intent Capture Benchmarks
Search is where intent becomes measurable demand capture. It’s also where benchmarks vary wildly by category, geography, and competition, so the best use is directional: are you trending toward healthier engagement and sustainable acquisition costs?
- Market-level reference: large benchmark compilations often cite an average Google Ads search CTR in the mid-single digits, like WordStream’s published 6.42% average CTR figure for 2024. Use it to sanity-check, then anchor decisions to your own time-series data and conversion quality.
- Cost context: dataset-driven analyses like Digital Position’s benchmark write-up cite an average U.S. CPC of $4.18 in 2024 based on a large keyword dataset. It’s not a universal truth, but it’s useful context for explaining why “just buy more clicks” isn’t a strategy.
Stack Efficiency Benchmark
One of the most overlooked performance benchmarks isn’t a channel metric at all. It’s operational: how much of your marketing technology you actually use. Gartner notes that martech utilization has dropped to 33%, and the same number appears in analysis that discusses the utilization decline as a strategic risk in TDWI coverage of the Gartner survey and in a market guide that references the Gartner survey utilization figure. If your stack is underused, performance will often feel “mysteriously inconsistent” because the system can’t support clean learning.
Analytics Interpretation
Good analytics interpretation is storytelling with constraints. The constraints are reality: attribution is imperfect, customers are messy, and platforms don’t measure the same thing the same way. Your job is to turn imperfect signals into good decisions without lying to yourself.
Separate Steering Metrics From Truth Metrics
Steering metrics help you drive week to week. Truth metrics help you decide what deserves more budget over months. If you mix them, you’ll either move too slowly (waiting for perfect certainty) or too recklessly (optimizing to a number that doesn’t represent real impact).
- Steering metrics: CTR, CPC, CPM, landing-page conversion rate, email click rate, frequency, creative fatigue signals.
- Truth metrics: qualified pipeline, retained revenue, incremental lift, contribution margins, long-term CAC vs LTV.
Treat Platform Reporting as a Signal, Not a Verdict
Platforms are optimized to measure what they can observe. That doesn’t make them dishonest; it makes them incomplete. This is why server-side measurement patterns exist, and why teams implement solutions like Meta’s Conversions API when they want more reliable event transfer than browser-only tracking can provide.
Use Lift and Incrementality When Decisions Are Expensive
When budgets get serious, the question becomes “what did marketing cause?” not “what did marketing touch?” Incrementality testing is designed to answer that, which is why Google frames it as a way to estimate the value that would not have happened otherwise in its incrementality testing guidance.
Build a Decision Narrative
If your dashboard can’t end in a decision, it’s not analytics—it’s decoration. A useful narrative usually has four parts: what changed, why it likely changed, what you’re doing next, and what you expect to learn. This structure is what keeps media and marketing teams from bouncing between random tactics.
Case Stories
Case stories matter because they reveal the human side of measurement: the pressure, the confusion, the moment a team realizes their reporting doesn’t match reality, and the discipline it takes to rebuild trust. These are real, source-backed examples where analytics influenced how media and marketing were run.
When an Incrementality Test Becomes the Only Thing Leadership Believes
The panic started quietly. Performance looked steady, but every meeting felt sharper, like the room was waiting for someone to admit the numbers didn’t mean what they used to. A big chunk of spend was tied to platform-reported conversions, and leadership wanted proof that the spend was actually adding sales rather than just taking credit for them.
The backstory was classic modern media and marketing. As tracking got harder and customer journeys got more fragmented, teams leaned more heavily on whatever reporting was easiest to access. Over time, that created a fragile confidence: results were “good,” but no one could explain how much of the outcome would have happened anyway. The team needed something defensible enough to survive a budget review.
The wall hit when optimization stopped feeling like progress. Tweaks improved some platform metrics, but the business-level outcomes didn’t move in a way that felt proportional. The more they optimized, the more suspicious leadership became, because the story sounded like “trust us, the algorithm knows.” The team was trapped between needing to act quickly and needing proof that action mattered.
The epiphany was realizing the only path forward was controlled measurement, not louder reporting. Meta’s documentation and partner ecosystem describe conversion lift studies as experiments designed to isolate the incremental impact of ads by comparing exposed and holdout groups in this conversion lift study explainer. That framing changed the internal conversation from “how do we attribute credit?” to “how do we prove causality?”
The journey became a rebuild. They had to define conversions that represented real business value, align stakeholders on what “success” would mean in a test, and accept that results might challenge their assumptions. They also had to clean up measurement plumbing so the experiment could observe outcomes consistently. The work was less glamorous than creative production, but it made future decisions possible.
The final conflict was emotional: lift studies can reveal uncomfortable truths. Some campaigns that looked great in standard reporting can look ordinary when measured for incremental impact, and that can threaten team identities and channel ownership. At the same time, campaigns that truly create lift earn the right to scale, and that creates political tension about where budget should go next.
The dream outcome is a budget conversation that stops being a debate and starts being a plan. Meta’s own case study library highlights brands using conversion lift to evaluate impact and guide spend, like the retailer example in this Meta partner conversion lift case study. When teams can point to incremental impact, media and marketing decisions become calmer, faster, and more confident.
When Marketing Mix Modeling Stops Channel Teams From Fighting Each Other
The drama here wasn’t a single failed campaign. It was the slow grind of multi-channel success turning into internal conflict. Every channel had wins, every channel had charts, and every channel could “prove” it deserved more budget. Instead of aligning the team, reporting was dividing it.
The backstory was a familiar evolution. As media and marketing expanded across more platforms, measurement became more complicated, and organizations started using different tools and definitions across teams. That fragmentation made it easy to tell comforting stories and hard to tell true ones. Leaders didn’t just want performance; they wanted a map of contribution.
The wall came during planning cycles. If the organization couldn’t agree on how channels worked together, it couldn’t confidently invest. Cutting any channel felt risky because “what if it’s secretly driving everything?” Scaling any channel felt risky because “what if it’s just capturing demand created elsewhere?” The organization needed a view of the system rather than isolated touchpoints.
The epiphany was embracing modeling as a shared language. Marketing mix modeling is commonly used to estimate contribution across channels and identify how investments interact, which is why Google positions MMM as a way to understand and grow a holistic marketing engine in its MMM growth engine article. The key shift is psychological: teams stop arguing about credit and start collaborating on impact.
The journey requires discipline. Inputs must be clean, the business needs to agree on outcome definitions, and leaders must commit to using model insights as directional guidance rather than a weapon. It also requires patience: MMM is strongest when it’s used consistently over time, not when it’s treated like a one-off “answer machine.” That consistency becomes a competitive advantage because learning compounds.
The final conflict is interpretation. Models can show that a channel contributes, but not always exactly how creative or experience should change next. Teams still need good experimentation and creative iteration to turn insight into growth. The trap is to outsource thinking to the model instead of using it to focus thinking.
The dream outcome is a marketing organization that can make big moves without panic. When leaders share a system-level view, they can fund demand creation without starving demand capture, and they can invest in retention because they understand long-term contribution. That’s when media and marketing start feeling like an operating system instead of a monthly argument.
Professional Promotion
“Promotion” in analytics doesn’t mean hype. It means making your work legible and valuable to other people. The best media and marketing operators don’t just run campaigns; they translate performance into decisions that stakeholders can understand, trust, and support.
How to Present Results With Credibility
If you want people to back your next budget request, don’t bury them in charts. Give them a narrative that respects uncertainty while still recommending action.
- Lead with business outcomes: revenue, pipeline quality, retention, margin, or whatever the business truly values.
- Show the measurement ladder: platform signals for speed, first-party signals for reality, and controlled methods for truth when stakes are high, like incrementality testing.
- Explain tradeoffs: what you are choosing to prioritize and what you are choosing not to chase.
Turn Insights Into a Public-Facing Asset
When you work in media and marketing—especially as a consultant or freelancer—your analytics can become proof of competence without revealing confidential numbers. You can publish “what we learned” patterns, document test frameworks, and show how you measure incrementality or lifecycle value. The goal is to demonstrate decision quality, not to flex vanity metrics.
A Simple Promotion Template You Can Reuse
When you’re sharing results internally or externally, this structure keeps it human and clear.
- Context: what problem you were solving and why it mattered.
- What changed: the one or two shifts that moved performance.
- Why it changed: the most plausible explanation backed by data.
- What you’re doing next: the next test, budget reallocation, or creative direction.
When you promote work this way, you don’t need to oversell. The clarity itself becomes persuasive—and it sets you up to run media and marketing as a repeatable system rather than a string of isolated wins.
Future Trends
The next wave of media and marketing won’t be won by teams with the most hacks. It’ll be won by teams that build systems that survive three realities: privacy constraints, auction pressure, and attention fragmentation.
Third-Party Cookies Become “Optional,” Not “Gone”
The industry spent years preparing for a clean cookie shutdown, then watched the plan change course. Google’s April 2025 decision to avoid a new standalone cookie prompt signaled that Chrome would keep cookie controls in settings instead of forcing universal deprecation, which immediately reshaped how marketers plan for identity and measurement in Reuters reporting on the change.
The practical implication is bigger than “cookies are back.” It means you can’t build your future strategy around one timeline. You build around resilience: first-party data, server-side event transfer, cohort-level reporting, and experiments that don’t depend on perfect user-level stitching.
Retail Media Becomes a Core Budget Line
Retail media is no longer a niche channel—it’s becoming one of the main ways brands buy measurable reach with commerce intent. WARC has highlighted retail media’s rise to the point where it is forecast to overtake linear TV spend globally in 2025 in WARC’s retail media datapoints.
For media and marketing teams, this pushes a new kind of operating discipline: product feeds, pricing parity, inventory strategy, and share-of-shelf now influence “ad performance” as much as creative and targeting do.
The Creator Economy Moves From “Channel” to “Category”
Creator partnerships are becoming a standalone strategy category with budgets that look more like media plans than one-off influencer deals. IAB research coverage points to U.S. creator economy ad spend rising from $29.5B in 2024 and being projected to reach $37B in 2025 in TV Tech’s summary of IAB’s report.
The trend underneath the trend is operational: brands are building creator sourcing, briefing, approvals, and measurement into repeatable workflows. The “fun part” is the content; the scaling advantage is the system.
Measurement Shifts Into Controlled Environments
As privacy constraints tighten, more measurement and audience analysis happens inside privacy-guarded environments that prioritize aggregation and controls. That’s why marketing teams increasingly plan around clean-room-style workflows and partner collaboration models, especially in retail media ecosystems where data sharing needs guardrails as described in Digital Commerce 360’s reporting on retailers experimenting with clean rooms.
AI Reshapes Creative and Operations Faster Than Strategy
AI will keep accelerating the speed of production, the speed of analysis, and the speed of iteration. The advantage won’t come from “using AI.” It will come from directing it with strong positioning, tight briefs, and a learning loop that improves creative and offers—not just volume.
Strategic Framework Recap

If you remember one thing from this guide, let it be this: media and marketing work best as a loop you can run repeatedly, not a set of disconnected campaigns.
- Strategy: one clear audience, one clear promise, and proof that reduces risk.
- Creative system: message pillars, proof library, and refresh rules so you never run out of momentum.
- Channel roles: demand creation, demand capture, and lifecycle each have a job and success definition.
- Experience: the landing journey matches the promise, and the post-purchase journey builds retention.
- Learning: weekly steering for speed, monthly reallocation for efficiency, and experiments for truth.
When you build it this way, you don’t need perfect platform reporting to make good decisions. You need a system that keeps improving, even when the ecosystem changes.
FAQ – Built for the Complete Guide
What does “media and marketing” mean in practice?
It’s the full system that moves a customer from first exposure to repeat purchase: the message, the distribution, the experience after the click (or view), and the measurement that tells you what to do next. When it’s working, every channel reinforces the same promise and every reporting cycle produces a decision.
What should I fix first if performance is unstable?
Start with alignment: does the ad promise match the landing page and the offer? Next, confirm signal quality so you’re not optimizing to broken tracking. Finally, look at creative fatigue—many “sudden drops” are simply audiences seeing the same message too often.
What metrics matter most in media and marketing?
Use a ladder. Weekly steering metrics (like CTR, CPC, landing conversion rate) help you avoid wasting budget fast. Business metrics (qualified pipeline, retained revenue, contribution margin) tell you whether growth is real. For high-stakes decisions, prioritize incrementality thinking so you’re measuring what your spend actually caused especially in a world where tracking assumptions keep changing.
How many channels should I run at once?
Fewer than you think. One demand-creation channel, one demand-capture channel, and one lifecycle channel is enough for most teams to build a strong learning loop. Add channels when you can clearly state the new channel’s job and how you’ll measure it.
Should I use retail media?
If you sell in retail or marketplaces (or can benefit from commerce-intent audiences), retail media is increasingly hard to ignore. WARC’s forecasts emphasize how quickly retail media is growing and how it is positioned to overtake linear TV spend globally in 2025 in WARC’s retail media datapoints.
How do I handle cookie and privacy changes without rebuilding everything?
Build resilience, not dependence. Use first-party data, server-side event transfer where appropriate, and measurement methods that don’t require perfect identity stitching. The fact that Google shifted away from forcing a universal cookie phase-out reinforces why “one timeline” planning is fragile as covered by Reuters.
What is the best tool stack for media and marketing?
The best stack is the one your team can actually run: clean tracking, a reliable source of truth for customer data, a CRM/lifecycle system, and analytics you trust. If your tools aren’t being used, simplify—utilization is a performance problem, not a procurement problem.
How do I know when to scale?
Scale when you have repeatable evidence, not one-time wins. You want stable performance across multiple creative concepts and a landing experience that converts consistently. If results only work with one exact ad, you don’t have a growth engine—you have a lucky shot.
Are creator partnerships worth it for serious growth?
Yes, if you treat creators like a system, not a stunt. IAB’s reported growth in creator economy ad spending—projected at $37B in the U.S. in 2025—signals how quickly budgets are shifting into this category in TV Tech’s summary of IAB research.
What does good creative testing look like?
It looks like a pipeline: multiple message angles, consistent production, and a learning log that turns results into your next briefs. Winning teams don’t “test ads.” They test beliefs: what promise matters, what proof convinces, and what friction blocks action.
How long does it take to see results?
You can often see directional signals quickly (click and conversion behavior), but reliable learning takes repeated cycles. The goal isn’t instant perfection—it’s getting faster at turning data into better creative, better offers, and better customer experiences.
How can a freelancer use this framework to win better clients?
Sell the system, not a channel. Companies hire freelancers when they feel chaos: unclear reporting, inconsistent creative, and spend that doesn’t translate into revenue. When you can explain how you’ll stabilize measurement, build a creative pipeline, and create a decision cadence, you position yourself as an operator—not “extra hands.”
Work With Professionals
Most companies don’t need more marketing noise. They need someone who can walk in, calm the chaos, and build a media and marketing system that holds up under pressure.
If you’re a marketing freelancer, you already know the painful part: you can do great work, but client acquisition can feel random—especially when platforms take a cut, gatekeep communication, or turn every conversation into a bidding war.
Markework is built around a simpler idea: connect directly, keep costs predictable, and remove per-project commissions. The platform positions itself as “no middleman, no project fees,” with monthly plans and direct communication between marketers and companies on the Markework homepage.
That matters because momentum is everything. When you can browse work, message directly, and keep the full value of what you earn, you stop negotiating against a platform’s incentives and start building relationships with real teams. Even the pricing pages are framed around “no commissions” and “no project fees,” with access described as thousands of job listings.
If you want a place to build a steady pipeline—without sacrificing a percentage of every invoice—start by setting up a profile, make your positioning clear, and use this guide’s framework to show clients you don’t just run campaigns. You build systems.
